
Jianjian TIAN, Xia MA, Min WANG, Heliang YAO, Zile HUA, Lingxia ZHANG. Sn Quantum Dots for Electrocatalytic Reduction of CO2 to HCOOH[J]. Journal of Inorganic Materials, 2021, 36(12): 1337
- Journal of Inorganic Materials
- Vol. 36, Issue 12, 1337 (2021)
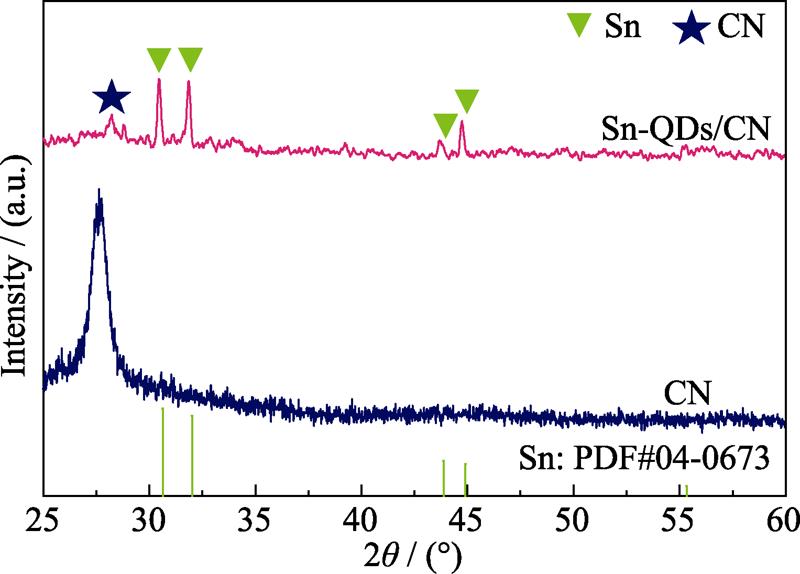
. XRD patterns of Sn-QDs/CN and CN
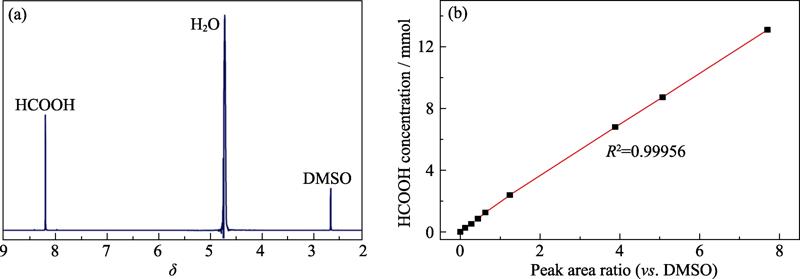
. 1H NMR spectrum of the cathodic electrolyte after CO2RR (a), and linear relationship between HCOOH concentration and relative peak area ratio (vs. DMSO) (b)
. TEM images at different magnifications (a, b) and corresponding EDS line scanning spectra (c) of Sn-p/CN; TEM image (inset: magnified image) (d), HRTEM image (e) and Sn-QDs size distribution (f) of Sn-QDs/CN
. High-resolution N1s XPS spectra of Sn-QDs and CN
. i-t curves of CO2RR on Sn-QDs/CN at different applied potentials (a), and Faradaic efficiencies of HCOOH, CO and H2 at different applied potentials on the Sn-QDs/CN electrode (b)
. High-resolution Sn3d (a) and O1s (b) XPS spectra of Sn-QDs/CN
. LSV curves of the Sn-QDs/CN electrode in Ar-(dotted line) and CO2-saturated (solid line) 0.1 mol·L-1 KHCO3 electrolyte at a scan rate of 30 mV·s-1 (a), and Faradaic efficiencies of HCOOH on Sn-QDs/CN and Sn-p/CN at a series of potentials (b)
. Faradaic efficiencies of CO and H2 at different applied potentials on CN
. Charging current density differences plotted against scan rates (a), electrochemical impedance spectra with inset showing the corresponding equivalent circuit (b), Tafel plots for HCOOH production on Sn-QDs/CN and Sn-p/CN (c), and the stability of Sn-QDs/CN catalyst at -1.0 V for 24 h in CO2-saturated 0.1 mol·L-1 KHCO3 (d)
. LSV curves of Sn-p/CN and Sn-QDs/CN in CO2-saturated 0.1 mol·L-1 KHCO3 electrolyte at a scan rate of 30 mV·s-1
. Proposed possible reaction pathway of CO2-to-HCOOH conversion on Sn-QDs/CN
|
Table 0. Comparison of various Sn-based catalysts for CO2-to-HCOOH conversion
|
Table 0. Fitted data of EIS for Sn-QDs/CN and Sn-p/CN


Set citation alerts for the article
Please enter your email address

© Copyright 2018-2021 | Chinese Laser Press. All Rights Reserved 沪ICP备15018463号-20