
Hao Zhang, Zhenming Song, Lujia Zhou, Zhaoqi Li, Qian Ma. Chirped Airy Pulse Modulated by Gaussian Pulse[J]. Acta Optica Sinica, 2022, 42(8): 0832001
- Acta Optica Sinica
- Vol. 42, Issue 8, 0832001 (2022)
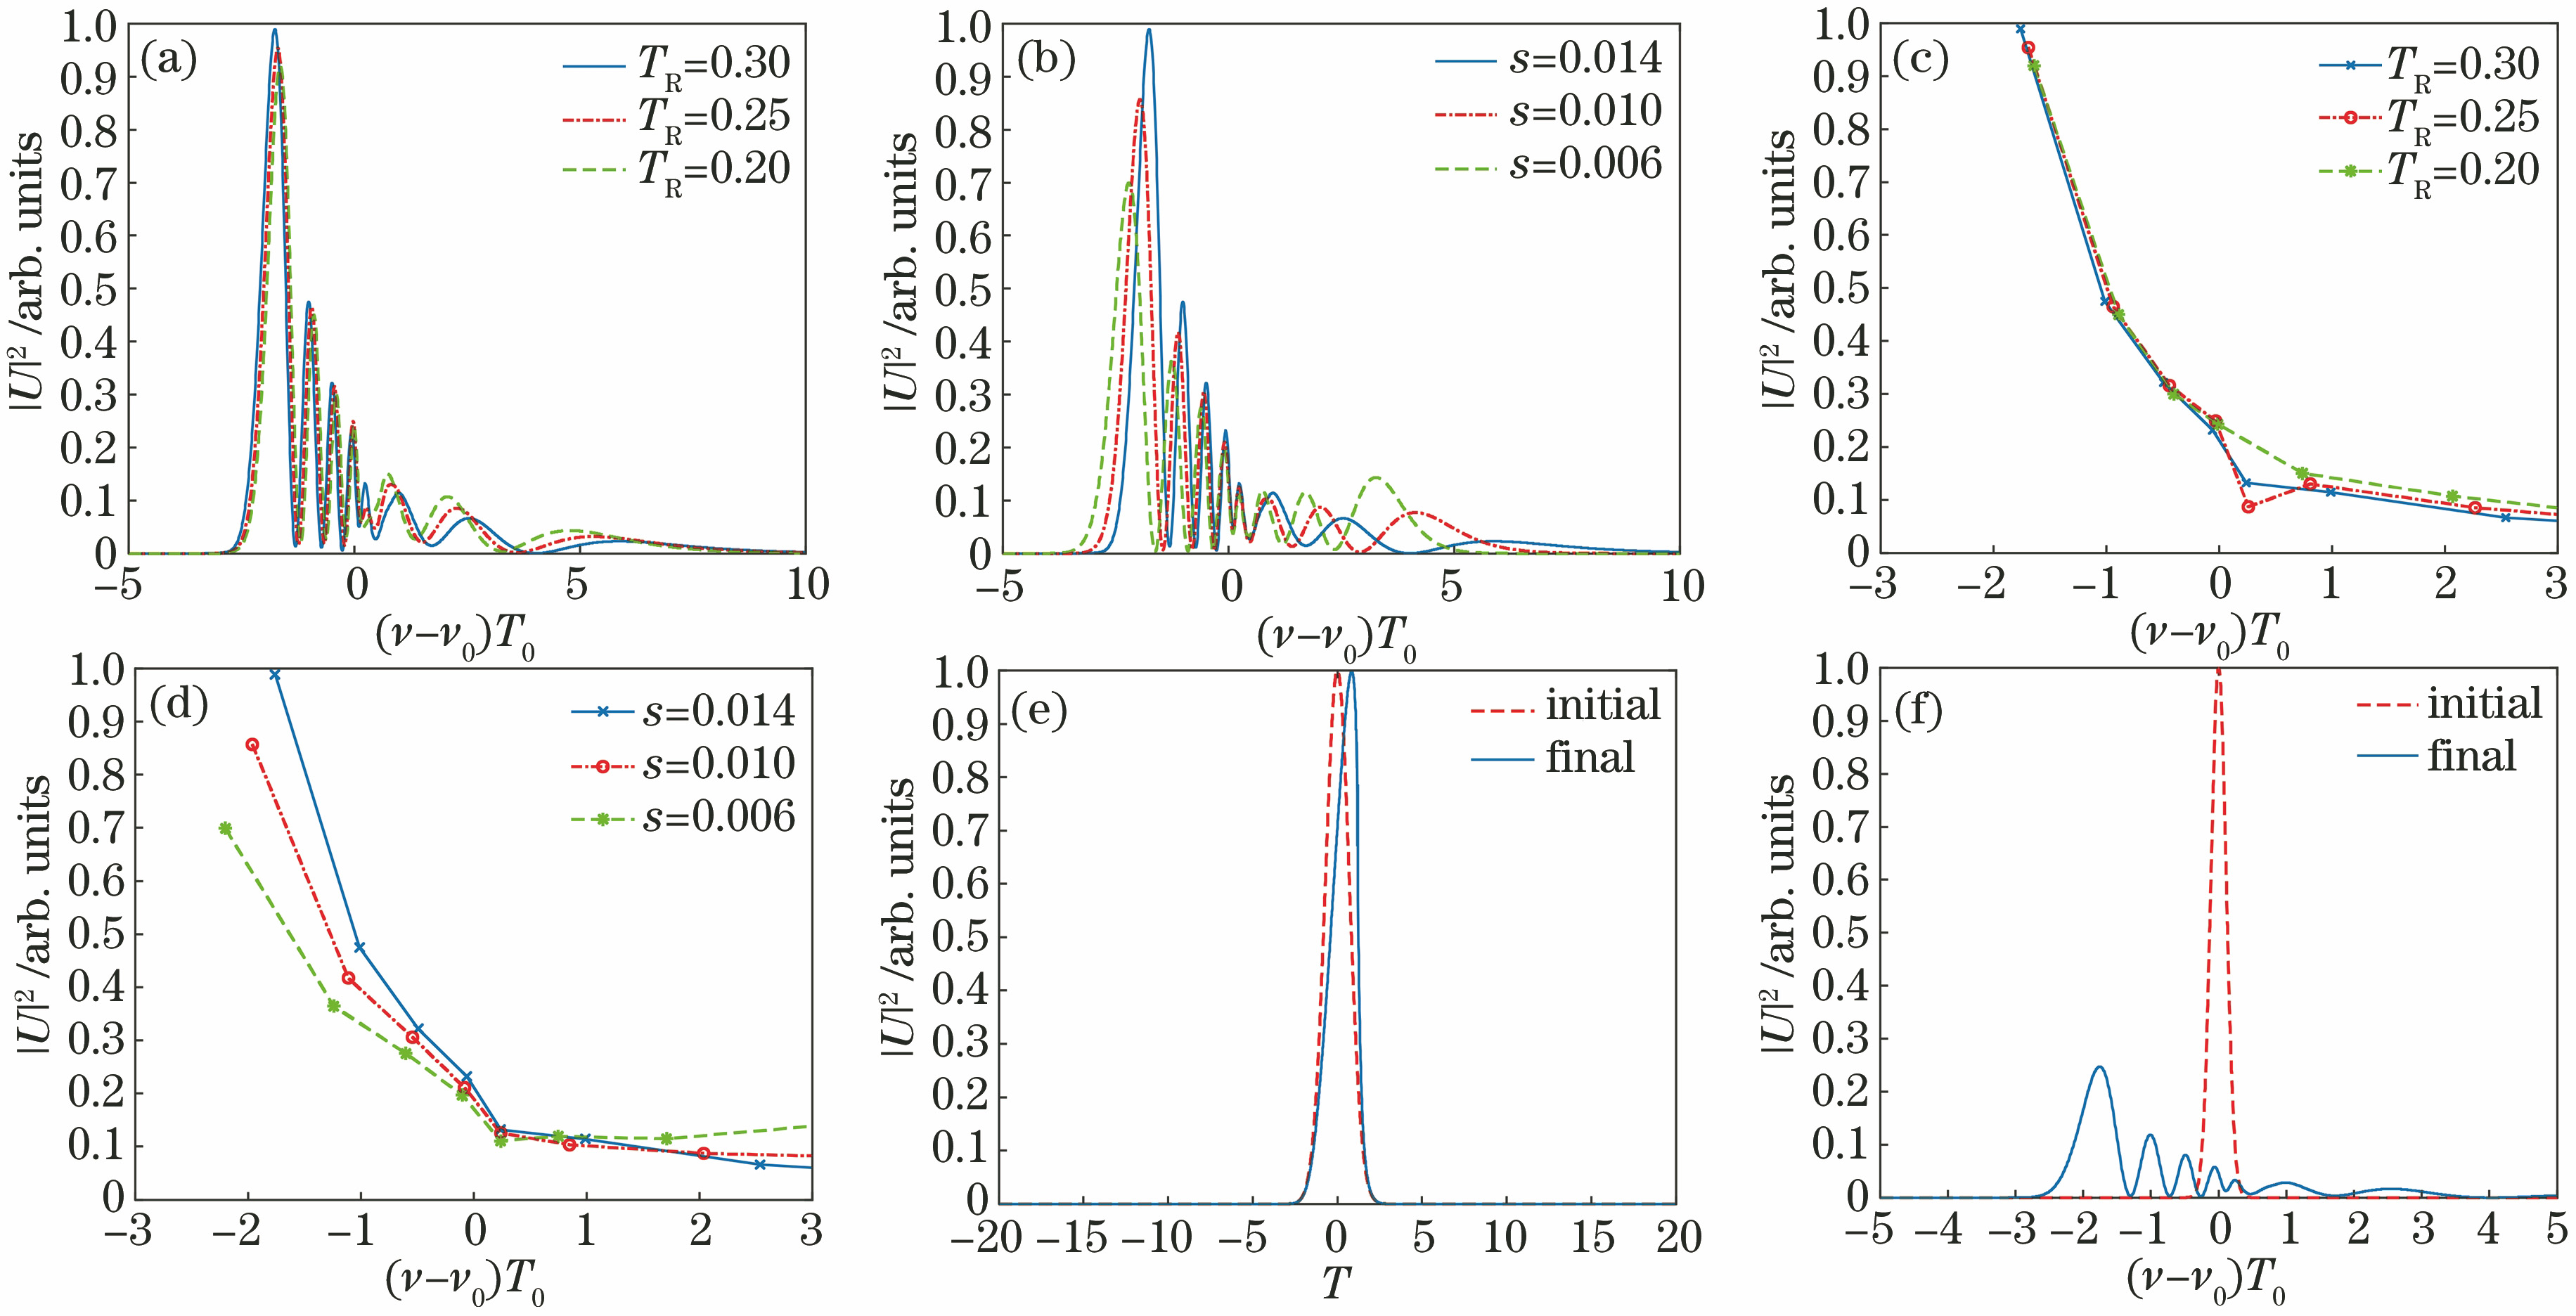
Fig. 1. Waveform of Gaussian pulse after modulation by nonlinear effect, when z=10 km, γ=2 km-1·W-1, s=0.014 fs-1, and TR=0.3 fs-1. (a) Raman coefficient; (b) self-steepness coefficient; (c) connection diagram of spectral peak points in Fig. (a); (d) connection diagram of spectral peak points in Fig. (b); (e) pulse time domain envelope; (f) spectrum diagram
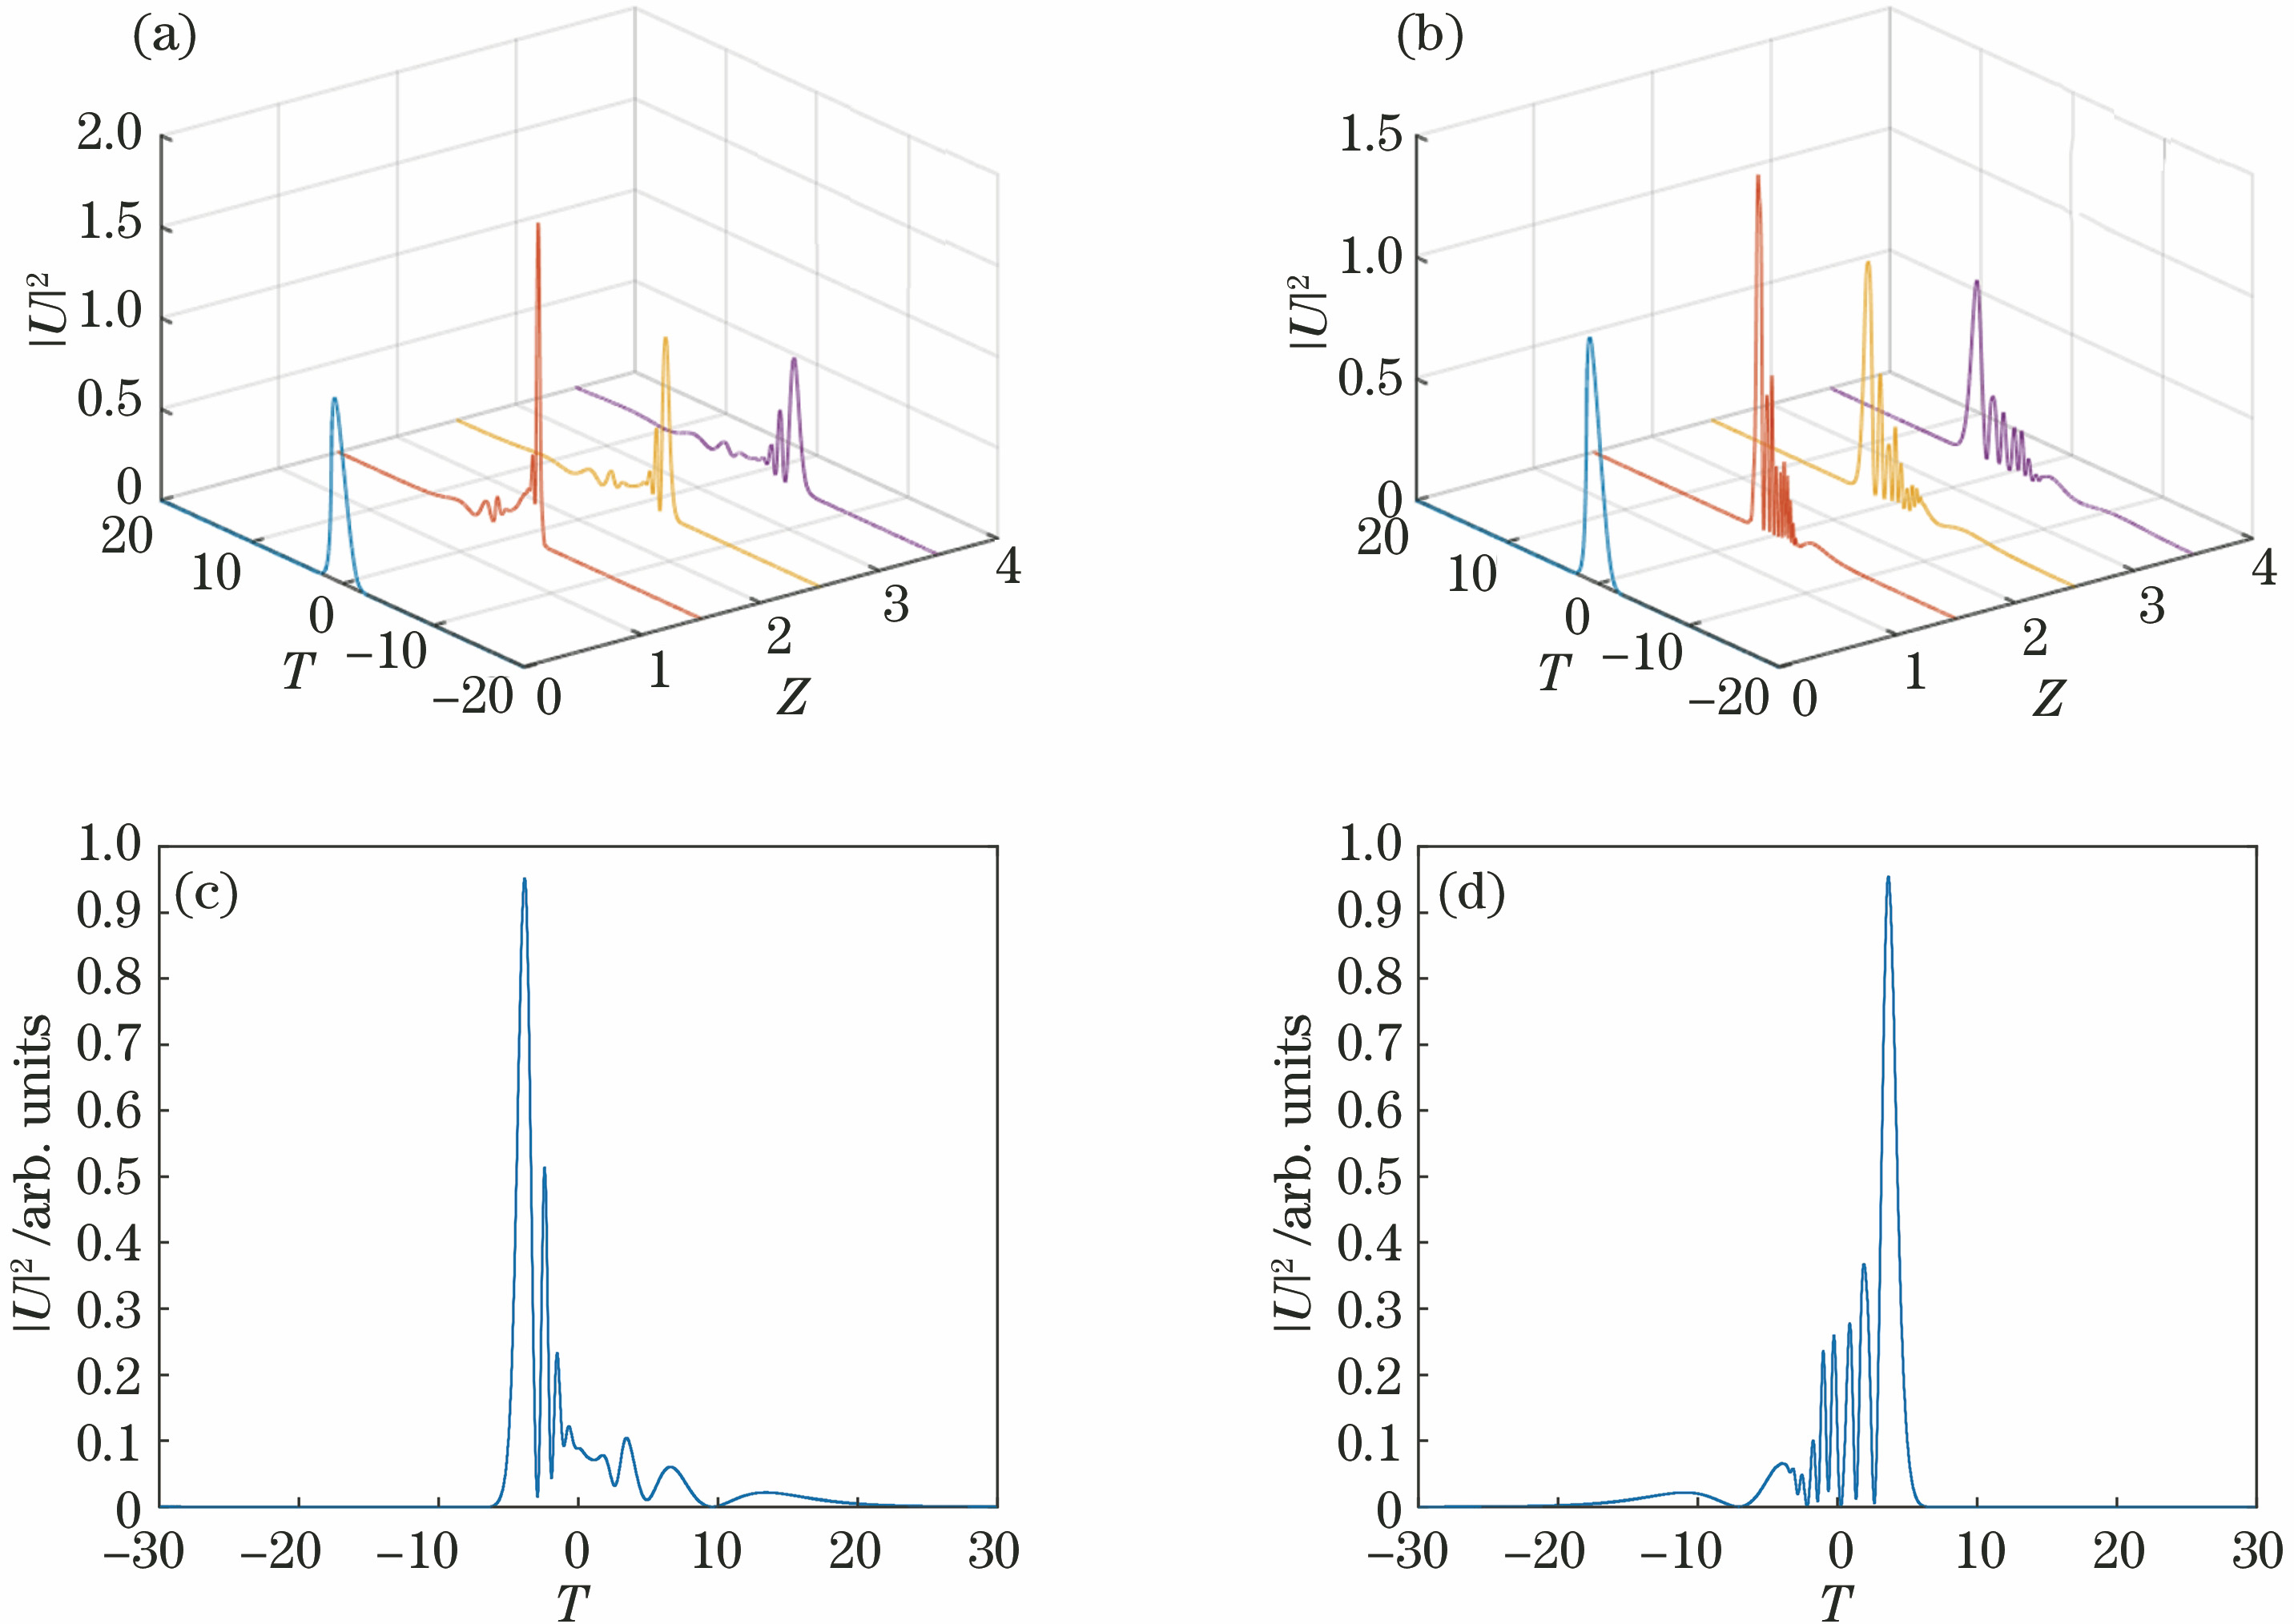
Fig. 2. Waveform of Gaussian pulse after adding group velocity dispersion, when Z=3.3 and β2=0.1. (a) Normal dispersion region, different transmission distance, (b) abnormal dispersion region, different transmission distance; (c) time domain envelope diagram of positive pulse; (d) time domain envelope diagram of inverse pulse
Fig. 3. Comparison of envelope of chirped Airy pulse and liked chirped Airy pulse, when a=0.05,C=-1.55. (a) Time domain envelope diagram of chirped Airy pulse under different truncation coefficients; (b) frequency spectrum of chirped Airy pulse under different chirp values; (c) pulse time domain envelope diagram; (d) spectrum diagram
Fig. 4. Time domain diagram of different pulses transmitted in different regions, when |β2|=

Set citation alerts for the article
Please enter your email address
© Copyright 2018-2021 | Chinese Laser Press. All Rights Reserved 沪ICP备15018463号-20