
Xu Wang, Enlai Wang, Fang Wang. Michelson interferometer composite cavity fiber laser sensor with radio frequency interrogation[J]. Chinese Optics Letters, 2022, 20(4): 040603
- Chinese Optics Letters
- Vol. 20, Issue 4, 040603 (2022)
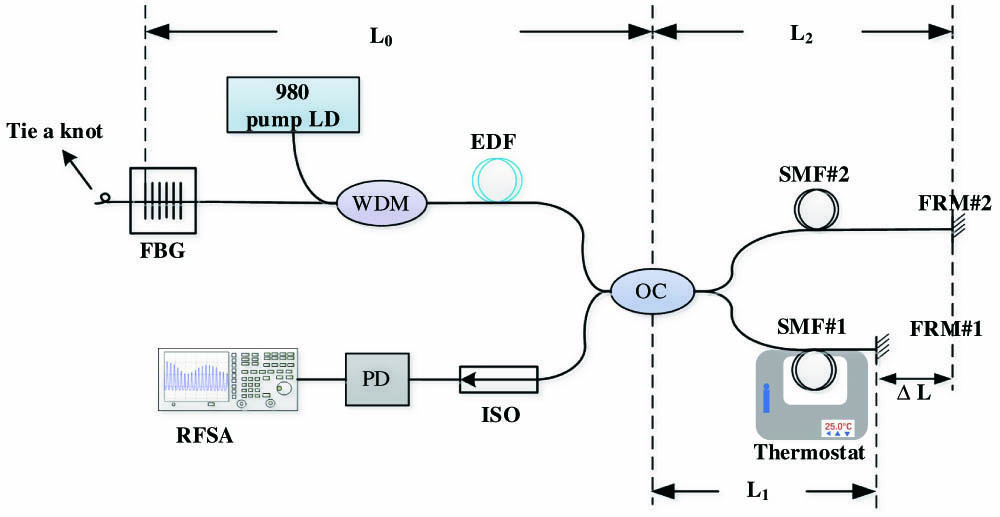
Fig. 1. Schematic diagram of the system. FBG, fiber Bragg grating; WDM, wavelength division multiplexer; EDF, erbium-doped fiber; OC, optical coupler; SMF, single-mode fiber; FRM, Faraday rotating mirror; ISO, fiber optical isolator; PD, photo-detector; RFSA, radio-frequency spectrum analyzer.
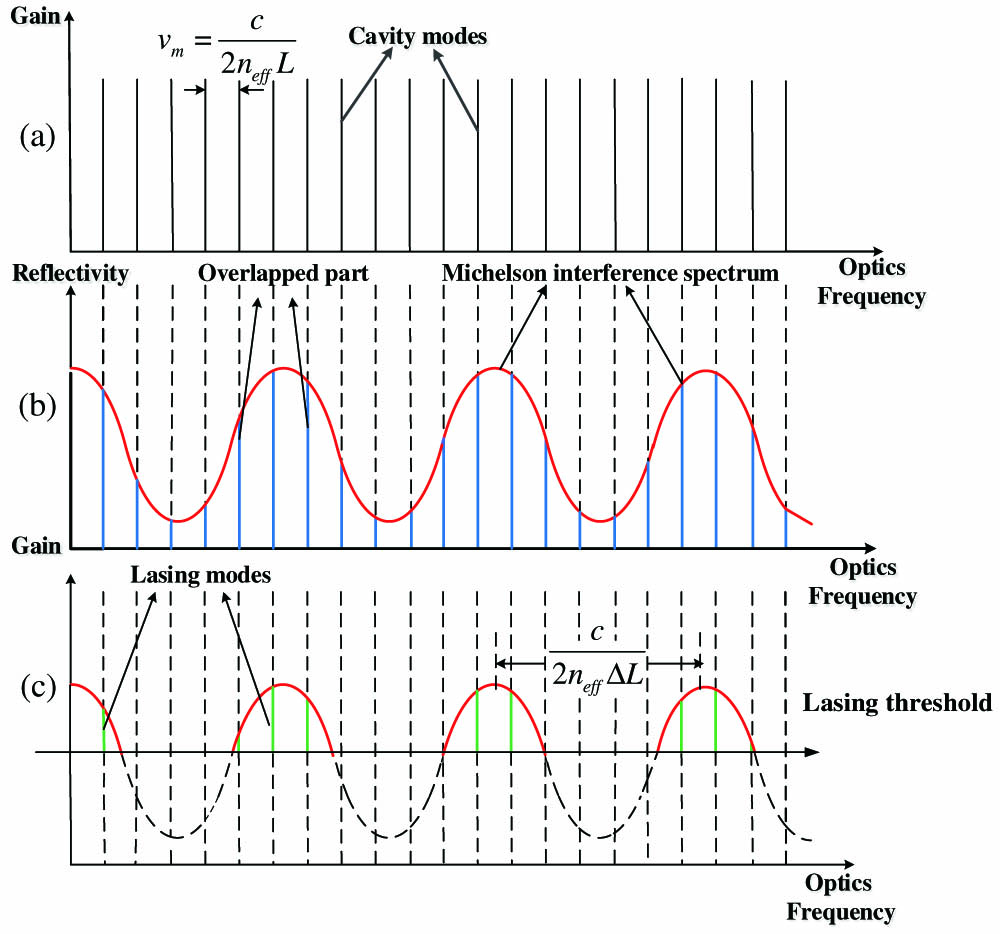
Fig. 2. Schematic view of the laser modes: (a) the cavity modes of the laser cavity; (b) interference spectrum of the MI and overlap with the laser cavity modes; (c) modes of the composite cavity.
Fig. 3. BFS envelope generated by the composite cavity.
Fig. 4. BFS envelope spectrum under different arm length differences: (a) the BFS envelope when the ΔL is 0.38 m; (b) the BFS envelope when the ΔL is 0.28 m.
Fig. 5. Details of the selected observation BFS envelope: (a) the BFS envelope with center frequency of 1092 MHz; (b) the BFS envelope with center frequency of 1106 MHz.
Fig. 6. Shift of BFS envelope with increasing temperature: (a) the shift of the BFS envelope with center frequency of 1092 MHz; (b) the shift of the BFS envelope with center frequency of 1106 MHz.
Fig. 7. Fitting result of frequency corresponding to the temperature change: (a) fitting result of the BFS envelope with center frequency of 1092 MHz; (b) fitting result of the BFS envelope with center frequency of 1106 MHz.
Fig. 8. Stability of the BFS envelope under 50°C measured every 10 min for 50 min.
Fig. 9. (a) Shift of BFS with center frequency of 1092 MHz; (b) comparison of the two fitting results.

Set citation alerts for the article
Please enter your email address
© Copyright 2018-2021 | Chinese Laser Press. All Rights Reserved 沪ICP备15018463号-20