• Photonics Research
  • Vol. 11, Issue 5, 829 (2023)
Ze-Zheng Li1, Zhen-Nan Tian1、3、*, Zhong-Tian Li1, Yang Ouyang1, Qi-Dai Chen1, and Hong-Bo Sun1、2、4、*
Author Affiliations
  • 1State Key Laboratory of Integrated Optoelectronics, College of Electronic Science and Engineering, Jilin University, Changchun 130012, China
  • 2State Key Laboratory of Precision Measurement Technology and Instruments, Department of Precision Instrument, Tsinghua University, Beijing 100084, China
  • 3e-mail: zhennan_tian@jlu.edu.cn
  • 4e-mail: hbsun@tsinghua.edu.cn
  • show less
    DOI: 10.1364/PRJ.484407 Cite this Article Set citation alerts
    Ze-Zheng Li, Zhen-Nan Tian, Zhong-Tian Li, Yang Ouyang, Qi-Dai Chen, Hong-Bo Sun. Photon propagation control on laser-written photonic chips enabled by composite waveguides[J]. Photonics Research, 2023, 11(5): 829 Copy Citation Text show less
    Schematic of the CWG method. (a) Coupling control between two waveguides by varying the β of waveguides. (b) and (c) are schematic and optical microscope photos of the waveguide cross-section and mode profiles of the SWG and CWG, respectively. (d) Schematic of equivalent transformation of the array Hamiltonian by placing CWGs in it. The scale bars in (b) and (c) are 10 μm.
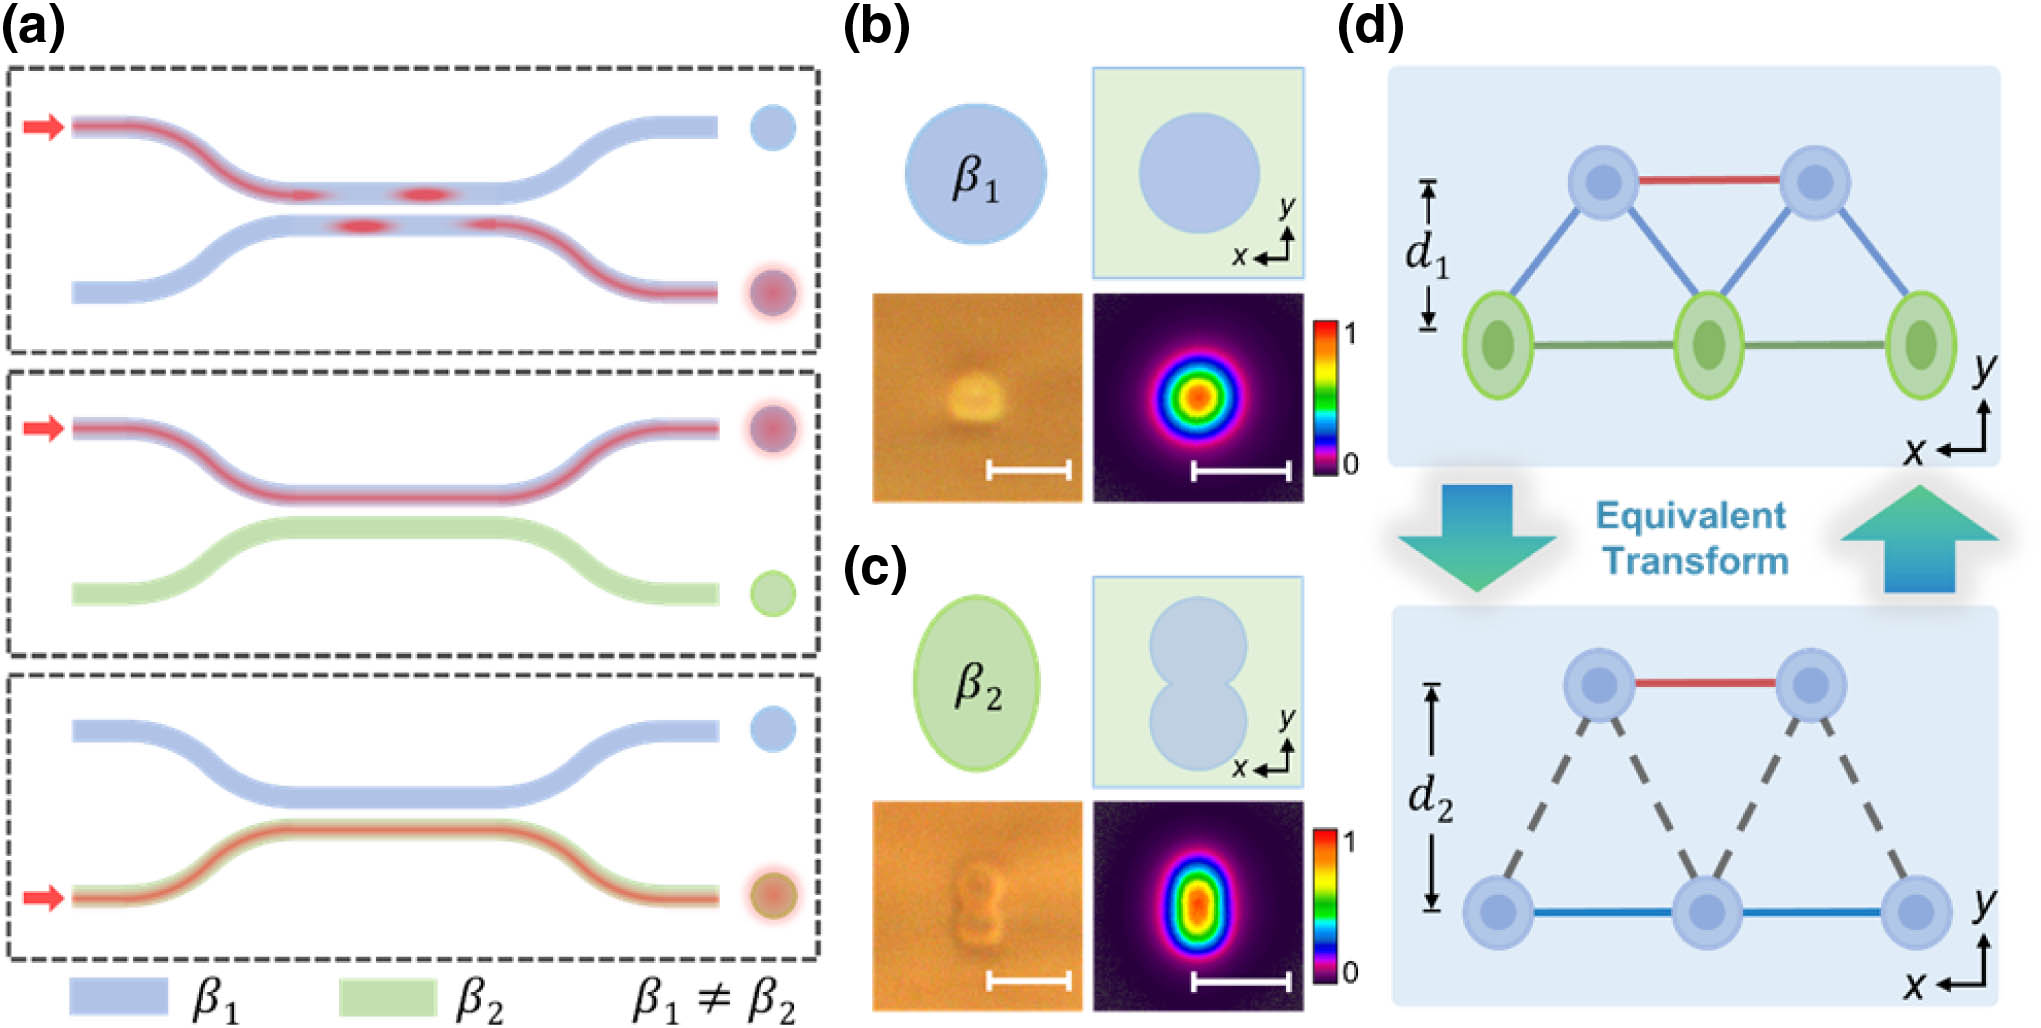
    Fig. 1. Schematic of the CWG method. (a) Coupling control between two waveguides by varying the β of waveguides. (b) and (c) are schematic and optical microscope photos of the waveguide cross-section and mode profiles of the SWG and CWG, respectively. (d) Schematic of equivalent transformation of the array Hamiltonian by placing CWGs in it. The scale bars in (b) and (c) are 10 μm.
    Characterization of the coupling properties between SWGs and CWGs. (a) Transmission of DCs composed of SWG and CWG with different central distances, and (b) the corresponding maximum transmission. (c) Propagation constant difference (Δβ) between the SWG of 40 mm/s writing velocity and the other waveguides, including SWGs with different writing velocities and CWGs with different central distances. (d) Crosstalk between SWGs and 3.6 μm central distance CWGs under 808 nm testing laser.
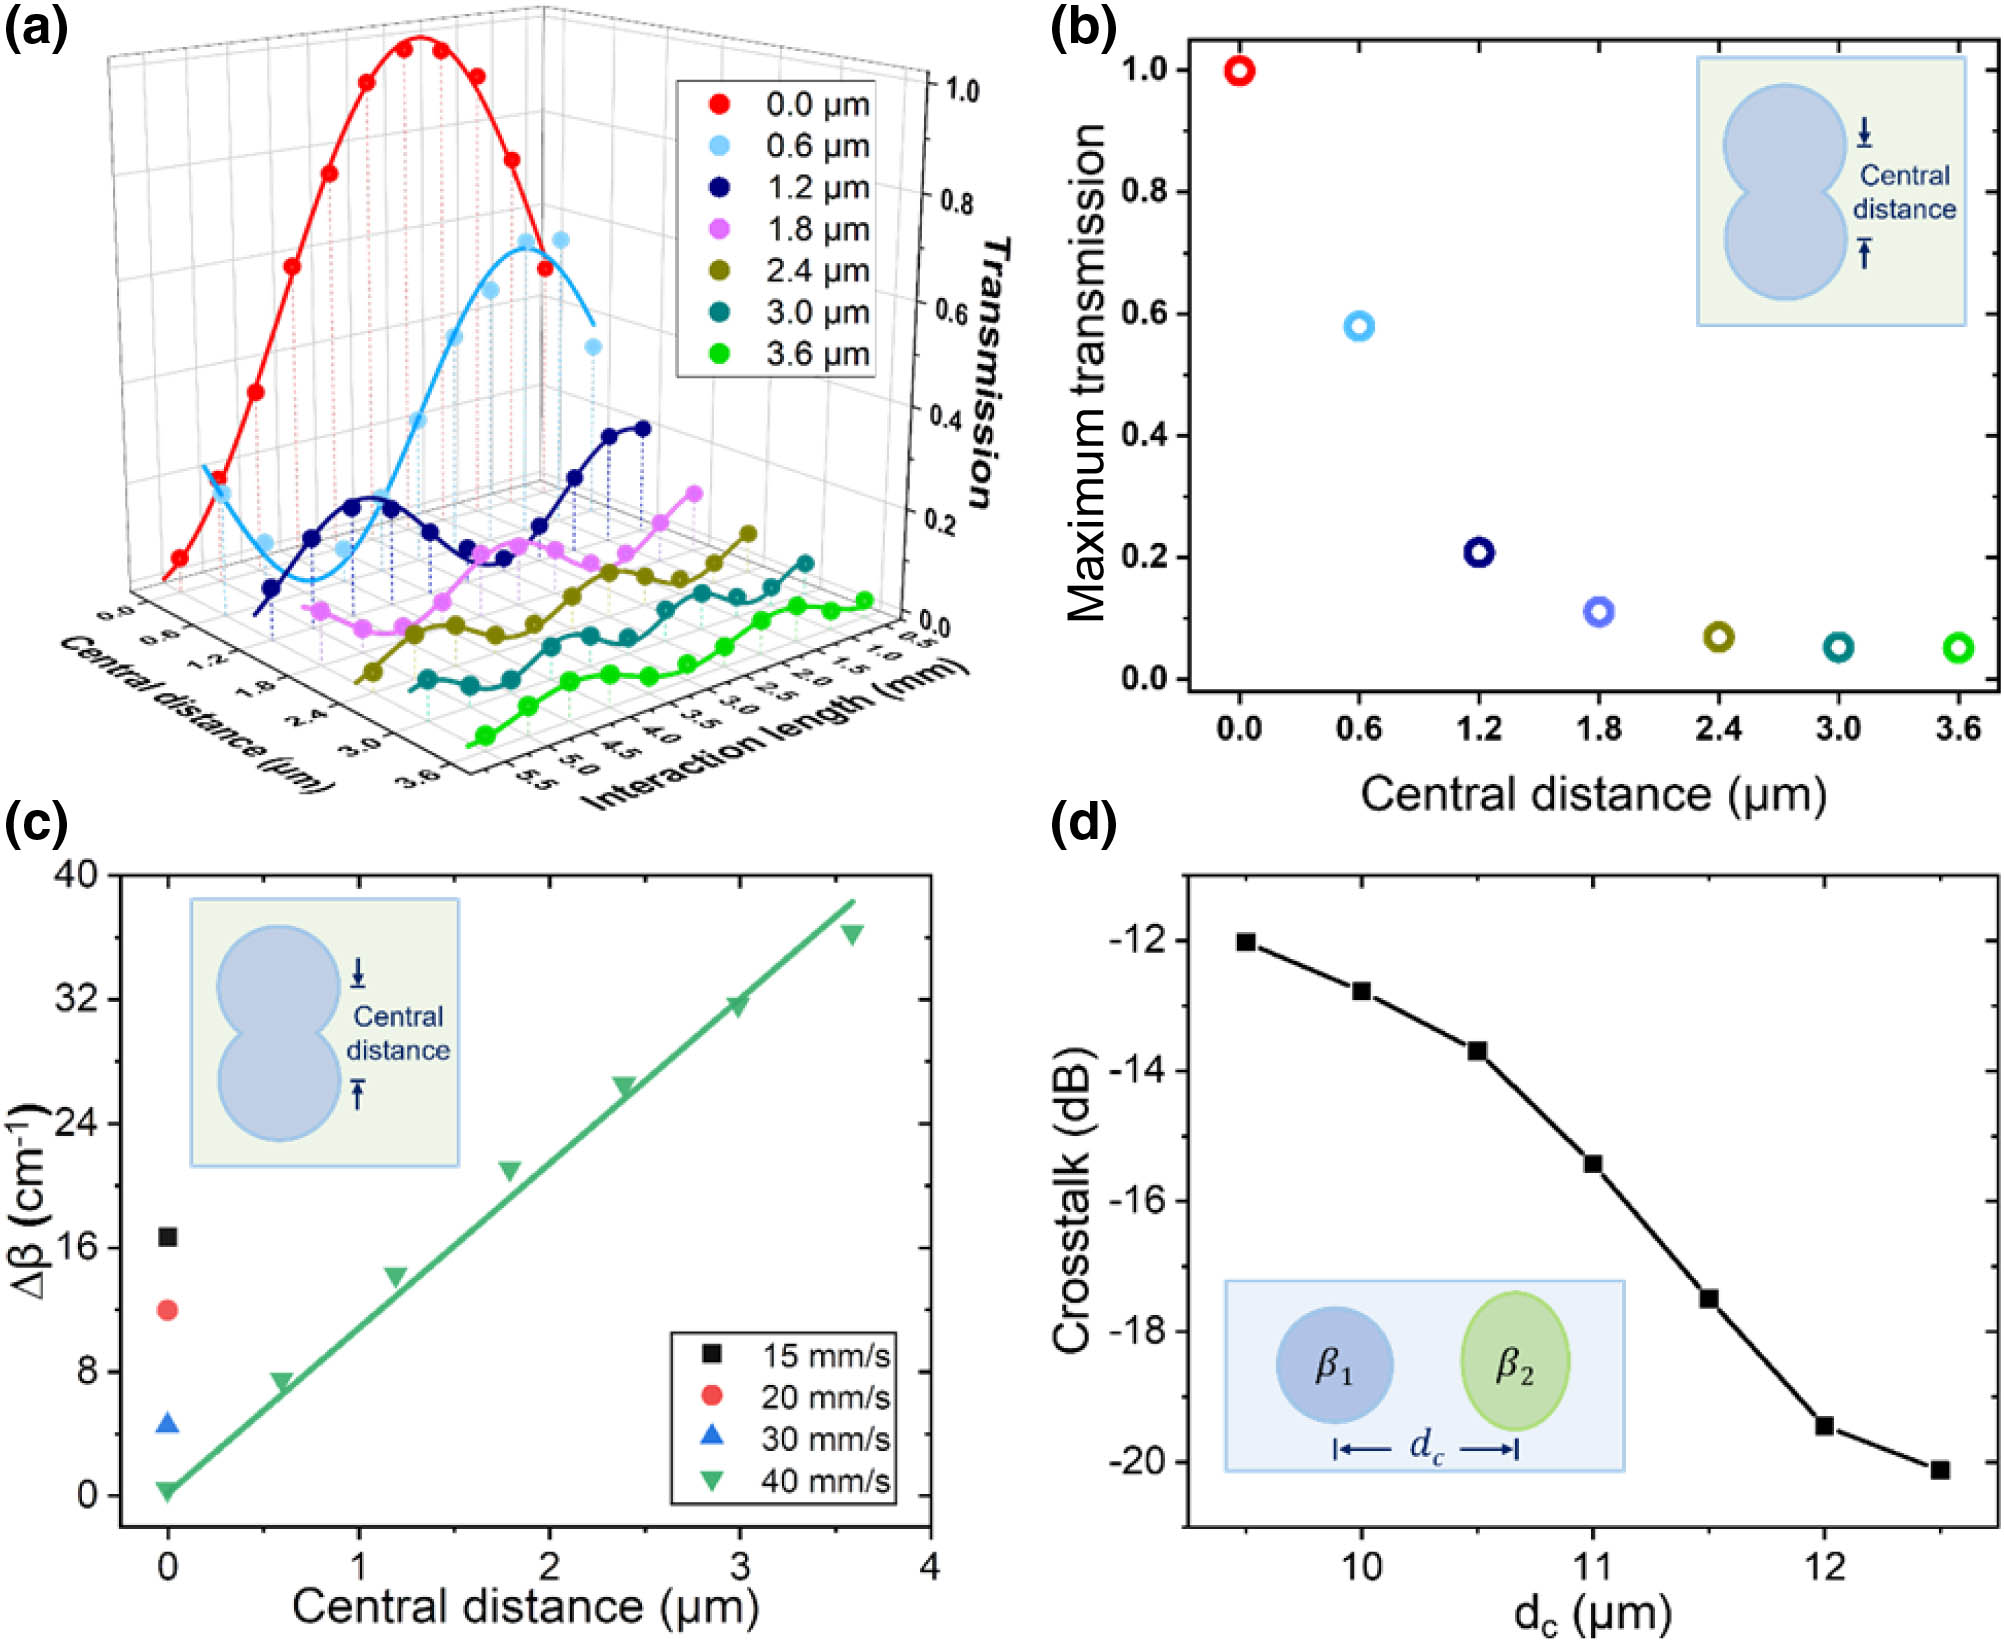
    Fig. 2. Characterization of the coupling properties between SWGs and CWGs. (a) Transmission of DCs composed of SWG and CWG with different central distances, and (b) the corresponding maximum transmission. (c) Propagation constant difference (Δβ) between the SWG of 40 mm/s writing velocity and the other waveguides, including SWGs with different writing velocities and CWGs with different central distances. (d) Crosstalk between SWGs and 3.6 μm central distance CWGs under 808 nm testing laser.
    Loss characterization of CWG. (a) Propagation loss of CWG. (b) Mode-mismatch loss between the CWG and the SWG with different lengths of taper.
    Fig. 3. Loss characterization of CWG. (a) Propagation loss of CWG. (b) Mode-mismatch loss between the CWG and the SWG with different lengths of taper.
    SL-DCs. (a) Schematic of traditional DCs and SL-DCs. (b) Schematic of CWG port of the SL-DC. The CWG of the transmission area and the SWG of the coupling area were connected through taper waveguides. The insets in (b) correspond to the cross-section images of the CWG port; all scale bars are 10 μm. (c) The V polarization transmission of SL-DC with SWG port input while the interaction distance ranges from 9 to 12 μm.
    Fig. 4. SL-DCs. (a) Schematic of traditional DCs and SL-DCs. (b) Schematic of CWG port of the SL-DC. The CWG of the transmission area and the SWG of the coupling area were connected through taper waveguides. The insets in (b) correspond to the cross-section images of the CWG port; all scale bars are 10 μm. (c) The V polarization transmission of SL-DC with SWG port input while the interaction distance ranges from 9 to 12 μm.
    SWG waveguide arrays and composite arrays. (a), (b) 3D schematics of the proposed waveguide arrays. (c), (d) Pictorial representation of the cross-section of the SWG array and the composite array. W1 to W5 were arranged in a trapezoidal form at the o−xy plane. κ1 to κ3 and κc are the coupling coefficients between different waveguides, while d1 is the gap between two layers. (e), (f) Corresponding optical microscope images of the cross-section regions of the SWG array and the composite array, respectively. The scale bars in (e) and (f) are 10 μm.
    Fig. 5. SWG waveguide arrays and composite arrays. (a), (b) 3D schematics of the proposed waveguide arrays. (c), (d) Pictorial representation of the cross-section of the SWG array and the composite array. W1 to W5 were arranged in a trapezoidal form at the oxy plane. κ1 to κ3 and κc are the coupling coefficients between different waveguides, while d1 is the gap between two layers. (e), (f) Corresponding optical microscope images of the cross-section regions of the SWG array and the composite array, respectively. The scale bars in (e) and (f) are 10 μm.
    Hamiltonian reconstruction through the CWG method. (a), (b) Theoretical and experimental normalized intensity of different waveguides when the laser was injected into W4 and W1 of the SWG array. The theoretical results correspond to the lines in (a) and (b). (c) Experimental cross-section mode profile images at propagation distances of 3, 5, and 7 mm with W4 and W1 input. (d), (e) Theoretical and experimental normalized intensity of different waveguides when the laser was injected into W4 and W1, respectively, of the composite array. Theoretical results correspond to the lines in (d) and (e). (f) Experimental cross-section mode profile images at propagation distances of 1, 5, and 9 mm with W4 and W1 input. The scale bars in (c) and (f) are 10 μm.
    Fig. 6. Hamiltonian reconstruction through the CWG method. (a), (b) Theoretical and experimental normalized intensity of different waveguides when the laser was injected into W4 and W1 of the SWG array. The theoretical results correspond to the lines in (a) and (b). (c) Experimental cross-section mode profile images at propagation distances of 3, 5, and 7 mm with W4 and W1 input. (d), (e) Theoretical and experimental normalized intensity of different waveguides when the laser was injected into W4 and W1, respectively, of the composite array. Theoretical results correspond to the lines in (d) and (e). (f) Experimental cross-section mode profile images at propagation distances of 1, 5, and 9 mm with W4 and W1 input. The scale bars in (c) and (f) are 10 μm.
    Characterization of cross-section morphology and mode properties of waveguides. Optical microscope images (a)–(e) and mode-profile images (f)–(j) of the cross-section of the single circular waveguide and waveguides with central distances of 0, 1.2, 2.4, and 3.6 μm, respectively. Scale bars in all images are 5 μm.
    Fig. 7. Characterization of cross-section morphology and mode properties of waveguides. Optical microscope images (a)–(e) and mode-profile images (f)–(j) of the cross-section of the single circular waveguide and waveguides with central distances of 0, 1.2, 2.4, and 3.6 μm, respectively. Scale bars in all images are 5 μm.
    Characterization of the coupling regions with different interaction lengths. (a1)–(a3) Energy distribution of two SWGs with an interaction distance of 10 μm. Energy distribution of the combination of an SWG and a 3.6 μm central-distance CWG when the laser was injected through (b1)–(b3) CWGs and (c1)–(c3) SWGs, respectively. Scale bars in all images are 5 μm.
    Fig. 8. Characterization of the coupling regions with different interaction lengths. (a1)–(a3) Energy distribution of two SWGs with an interaction distance of 10 μm. Energy distribution of the combination of an SWG and a 3.6 μm central-distance CWG when the laser was injected through (b1)–(b3) CWGs and (c1)–(c3) SWGs, respectively. Scale bars in all images are 5 μm.
    (a) Transmission of SL-DC injected with the V polarization laser through the CWG port while the interaction distance ranges from 9 to 12 μm. Experimental cross-section modal profiles of SL-DCs with 9 μm interaction distance while being injected with the SWG port (b)–(d) and the CWG port (e)–(g). The injected light could be nearly fully coupled from the injected port to the adjacent port. Scale bars in (b)–(g) are all 5 μm.
    Fig. 9. (a) Transmission of SL-DC injected with the V polarization laser through the CWG port while the interaction distance ranges from 9 to 12 μm. Experimental cross-section modal profiles of SL-DCs with 9 μm interaction distance while being injected with the SWG port (b)–(d) and the CWG port (e)–(g). The injected light could be nearly fully coupled from the injected port to the adjacent port. Scale bars in (b)–(g) are all 5 μm.
    Transmission of SL-DC injected with the H polarized laser through (a) the CWG port and (b) the SWG port.
    Fig. 10. Transmission of SL-DC injected with the H polarized laser through (a) the CWG port and (b) the SWG port.
    Calculated light wave evolution in the SWG array and composite array by the CMT. (a), (b) Theoretical evolution of light in the SWG array when injected through W4 and W1, respectively. The insets are the calculated cross-sectional profiles at the propagation distance of 3, 5, and 7 mm. (c), (d) Theoretical evolution of light in the composite array when injected through W4 and W1, respectively. The insets are the calculated cross-sectional profiles at the propagation distance of 1, 5, and 9 mm.
    Fig. 11. Calculated light wave evolution in the SWG array and composite array by the CMT. (a), (b) Theoretical evolution of light in the SWG array when injected through W4 and W1, respectively. The insets are the calculated cross-sectional profiles at the propagation distance of 3, 5, and 7 mm. (c), (d) Theoretical evolution of light in the composite array when injected through W4 and W1, respectively. The insets are the calculated cross-sectional profiles at the propagation distance of 1, 5, and 9 mm.
    Corresponding equivalent SWG array of the composite array in Fig. 6. (a) Pictorial representation of the cross-section of the equivalent array. W1 to W5 were arranged in a trapezoidal form at the o−xy plane. (b) Optical microscope images of the composite array cross-section. The distance between the shallower layer and the deeper was 18 μm. (c) and (d), (e) and (f), and (g) and (h) are the experimental laser intensity distributions of the array cross-section under the propagation distance of 1, 5, and 9 mm when the laser was injected into W1 and W4. The scale bars in (b)–(h) are 10 μm.
    Fig. 12. Corresponding equivalent SWG array of the composite array in Fig. 6. (a) Pictorial representation of the cross-section of the equivalent array. W1 to W5 were arranged in a trapezoidal form at the oxy plane. (b) Optical microscope images of the composite array cross-section. The distance between the shallower layer and the deeper was 18 μm. (c) and (d), (e) and (f), and (g) and (h) are the experimental laser intensity distributions of the array cross-section under the propagation distance of 1, 5, and 9 mm when the laser was injected into W1 and W4. The scale bars in (b)–(h) are 10 μm.
    Ze-Zheng Li, Zhen-Nan Tian, Zhong-Tian Li, Yang Ouyang, Qi-Dai Chen, Hong-Bo Sun. Photon propagation control on laser-written photonic chips enabled by composite waveguides[J]. Photonics Research, 2023, 11(5): 829
    Download Citation