Author Affiliations
1Key Laboratory of Grain Information Processing and Control of Ministry of Education, Henan University of Technology, Zhengzhou 450001, Henan , China2Zhengzhou Key Laboratory of Machine Perception and Intelligent System, Henan University of Technology, Zhengzhou 450001, Henan , China3College of Information Science and Engineering, Henan University of Technology, Zhengzhou 450001, Henan , Chinashow less
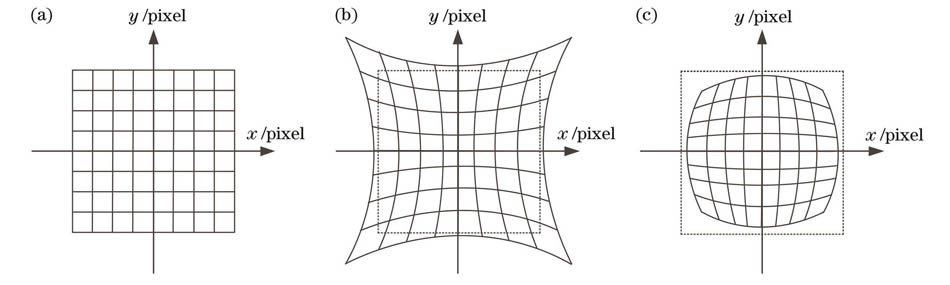
Fig. 1. Radial distortion. (a) Ideal image with no distortion; (b) pin-cushion distortion; (c) barrel distortion
Fig. 2. Schematic of vanishing point
Fig. 3. Target diagrams. (a) Target diagram on space plane; (b) target projection and vanishing point schematic on image plane
Fig. 4. Specific steps of proposed method
Fig. 5. Original images of checkerboard targets. (a) Image 1; (b) image 2; (c) image 3
Fig. 6. Corrected images using proposed method. (a) Image 1; (b) image 2; (c) image 3
Fig. 7. Comparison of distorted-point and corrected-point. (a) Image 1; (b) image 2; (c) image 3
Fig. 8. Feature point selection. (a) An image of a chessboard; (b) detected grid (select the red dot of each line to calculate the CR of the line)
Fig. 9. Comparison of ASE
Fig. 10. Comparison of distortion correction results by different methods. (a) Image 1; (b) image 2; (c) image 3
Fig. 11. Comparison of correction effect (CR). (a) Image 1; (b) image 2; (c) image 3
Image | Row No. | R0 | Rorigin | Rundc | Rdc | ΔRorigin | ΔRundc | ΔRdc |
---|
Image 1 | 1 | 1.5625 | 1.5372 | 1.5609 | 1.5614 | 0.0253 | 0.0016 | 0.0011 | 2 | 1.5625 | 1.5355 | 1.5615 | 1.5619 | 0.0270 | 0.0010 | 0.0006 | 3 | 1.5625 | 1.5359 | 1.5624 | 1.5627 | 0.0266 | 0.0001 | 0.0002 | 4 | 1.5625 | 1.5359 | 1.5627 | 1.5629 | 0.0266 | 0.0002 | 0.0004 | 5 | 1.5625 | 1.5371 | 1.5624 | 1.5628 | 0.0254 | 0.0001 | 0.0003 | 6 | 1.5625 | 1.5369 | 1.5611 | 1.5619 | 0.0256 | 0.0014 | 0.0006 | Image 2 | 1 | 1.5625 | 1.5383 | 1.5614 | 1.5621 | 0.0242 | 0.0011 | 0.0004 | 2 | 1.5625 | 1.5376 | 1.5608 | 1.5628 | 0.0249 | 0.0017 | 0.0003 | 3 | 1.5625 | 1.5377 | 1.5612 | 1.5626 | 0.0248 | 0.0013 | 0.0001 | 4 | 1.5625 | 1.5379 | 1.5616 | 1.5624 | 0.0246 | 0.0009 | 0.0001 | 5 | 1.5625 | 1.5377 | 1.5614 | 1.5626 | 0.0248 | 0.0011 | 0.0001 | 6 | 1.5625 | 1.5372 | 1.5606 | 1.5627 | 0.0253 | 0.0019 | 0.0002 | Image 3 | 1 | 1.5625 | 1.5364 | 1.5623 | 1.5626 | 0.0261 | 0.0002 | 0.0001 | 2 | 1.5625 | 1.5352 | 1.5619 | 1.5620 | 0.0273 | 0.0006 | 0.0005 | 3 | 1.5625 | 1.5359 | 1.5624 | 1.5626 | 0.0266 | 0.0001 | 0.0001 | 4 | 1.5625 | 1.5374 | 1.5629 | 1.5628 | 0.0251 | 0.0004 | 0.0003 | 5 | 1.5625 | 1.5362 | 1.5620 | 1.5621 | 0.0263 | 0.0005 | 0.0004 | 6 | 1.5625 | 1.5369 | 1.5615 | 1.5618 | 0.0256 | 0.0010 | 0.0007 | Average | 1.5625 | 1.5368 | 1.5617 | 1.5624 | 0.0257 | 0.0008 | 0.0004 |
|
Table 1. Comparison of CR
Coefficient | k1 /10-8 | k2 /10-13 | p1 /10-5 | p2 /10-6 | s1 /10-5 | s2 /10-6 | cx | cy |
---|
Model before correction | -2.3336 | 0.0042 | 5.8830 | 1.8824 | 1.1894 | -5.0863 | 400 | 300 | Model after correction | -2.4145 | 0.5450 | 3.0599 | 2.9498 | 2.0219 | 0.5907 | 430.2705 | 283.5048 |
|
Table 2. Coefficients of distortion model
Image | E0 | E[23] | E[28] | EPM |
---|
Average | 0.0246 | 0.0080 | 0.0096 | 0.0018 | Image 1 | 0.0253 | 0.0099 | 0.0108 | 0.0025 | Image 2 | 0.0240 | 0.0078 | 0.0094 | 0.0013 | Image 3 | 0.0245 | 0.0062 | 0.0086 | 0.0017 |
|
Table 3. Comparison of ASE