• Laser & Optoelectronics Progress
  • Vol. 56, Issue 4, 041001 (2019)
Song Xue1, Siyu Zhang2、**, and Yongfeng Liu1、*
Author Affiliations
  • 1 Department of Weapons Engineering, Army Academy of Artillery and Air Defense, Hefei, Anhui 230000, China
  • 2 Postgraduate Team 1, Army Academy of Artillery and Air Defense, Hefei, Anhui 230000, China
  • show less
    DOI: 10.3788/LOP56.041001 Cite this Article Set citation alerts
    Song Xue, Siyu Zhang, Yongfeng Liu. Quality Assessment of Hyperspectral Super-Resolution Images[J]. Laser & Optoelectronics Progress, 2019, 56(4): 041001 Copy Citation Text show less
    Super-resolution reconstruction effects of 25th, 50th, 75th and 100th band images. (a) Hyperspectral image; (b) hyperspectral super-resolution image; (c) scene image blocks for hyperspectral image; (d) scene image blocks for hyperspectral super-resolution image
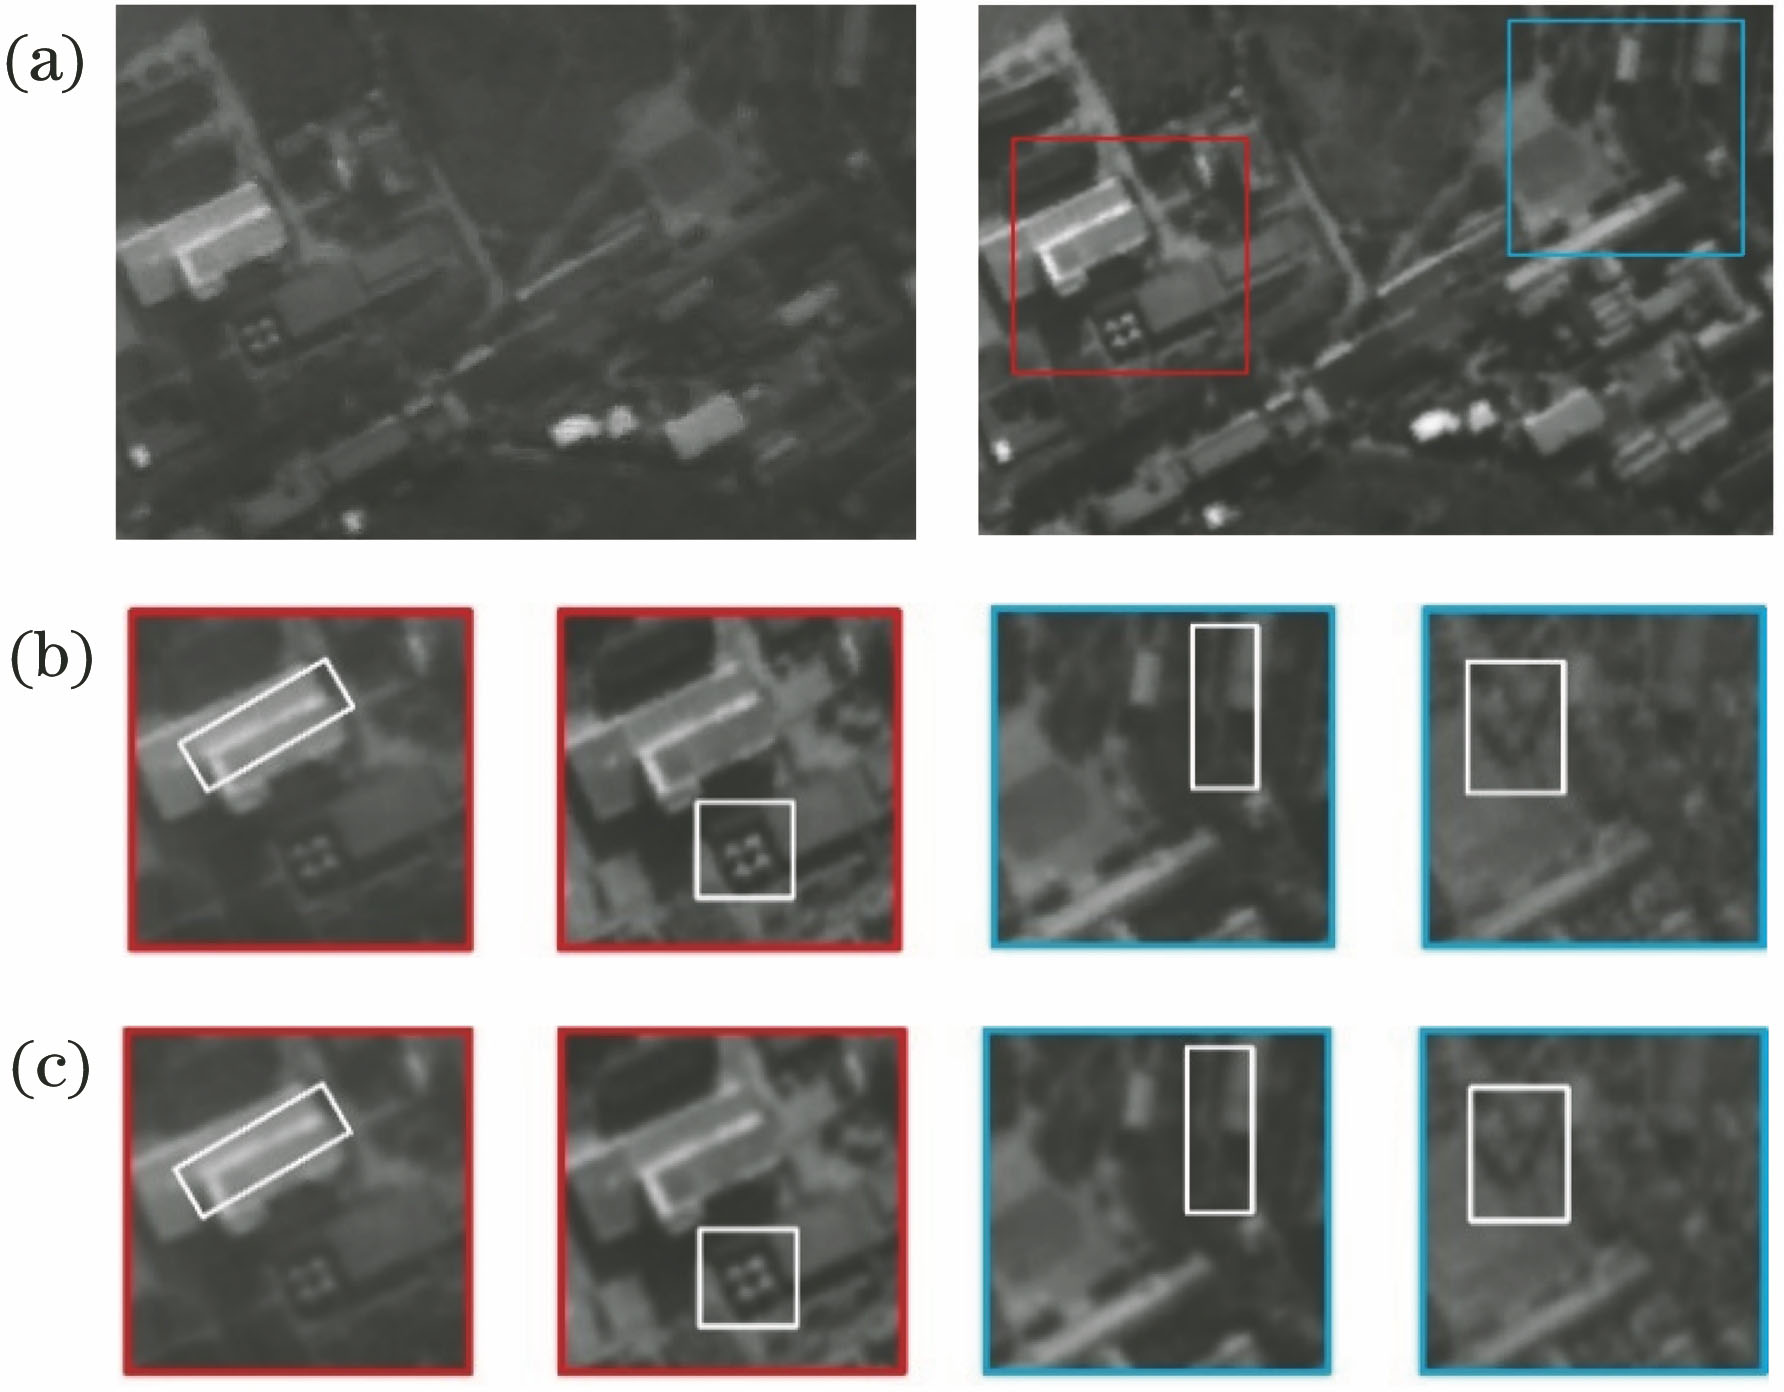
    Fig. 1. Super-resolution reconstruction effects of 25th, 50th, 75th and 100th band images. (a) Hyperspectral image; (b) hyperspectral super-resolution image; (c) scene image blocks for hyperspectral image; (d) scene image blocks for hyperspectral super-resolution image
    Statistical regularity of MSCN
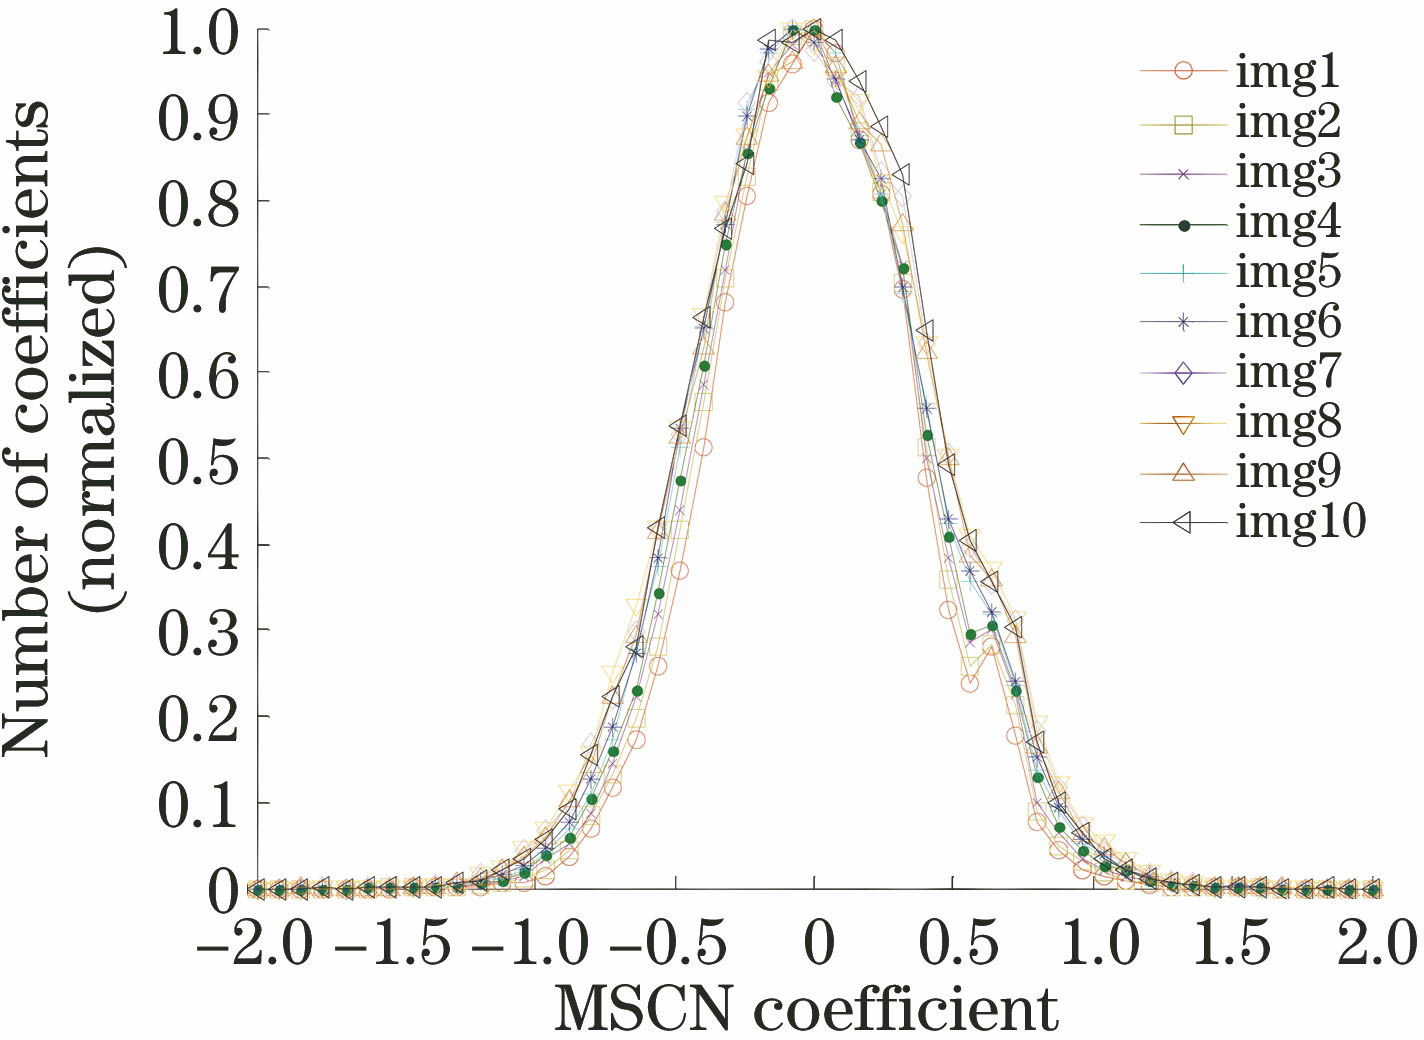
    Fig. 2. Statistical regularity of MSCN
    Extraction method of adjacent factors
    Fig. 3. Extraction method of adjacent factors
    Statistic of adjacent factors along four directions. (a) Horizontal direction; (b) vertical direction; (c) main-diagonal direction; (d) secondary-diagonal direction
    Fig. 4. Statistic of adjacent factors along four directions. (a) Horizontal direction; (b) vertical direction; (c) main-diagonal direction; (d) secondary-diagonal direction
    GLBP feature maps of hyperspectral super-resolution images. (a) 10th band; (b) 20th band; (c) 30th band; (d) 40th band; (e) 50th band; (f) 60th band; (g) 70th band; (h) 80th band; (i) 90th band; (j) 100th band
    Fig. 5. GLBP feature maps of hyperspectral super-resolution images. (a) 10th band; (b) 20th band; (c) 30th band; (d) 40th band; (e) 50th band; (f) 60th band; (g) 70th band; (h) 80th band; (i) 90th band; (j) 100th band
    Flow chart of algorithm model
    Fig. 6. Flow chart of algorithm model
    Scatter plots by different models. (a) BLIINDS-II; (b) QAC; (c) BRISQUE; (d) NIQE; (e) proposed algorithm
    Fig. 7. Scatter plots by different models. (a) BLIINDS-II; (b) QAC; (c) BRISQUE; (d) NIQE; (e) proposed algorithm
    ParameterBLIINDS-IIQACBRISQUENIQEProposed algorithm
    SROCC0.31940.47470.67380.49000.8412
    PLCC0.38760.30970.71720.55800.8763
    Table 1. Algorithm test results of all algorithms
    ParameterImagelibrary 1Imagelibrary 2Imagelibrary 3Imagelibrary 4Imagelibrary 5Imagelibrary 6Imagelibrary 7
    SROCC0.80320.81630.81960.83910.83440.83150.8367
    PLCC0.81660.81460.83430.85670.83730.84620.8596
    ParameterImagelibrary 8Imagelibrary 9Imagelibrary 10Imagelibrary 11Imagelibrary 12Imagelibrary 13Imagelibrary 14
    SROCC0.84180.84980.83110.83230.83780.82880.8216
    PLCC0.86210.86430.85370.84560.85270.83620.8354
    Table 2. Subjective-objective assessment results for 14 groups of image libraries
    AlgorithmBLIINDS-IIQACBRISQUENIQEProposed algorithm
    Time42.30.20.30.525.6
    Table 3. Runtime of all algorithmss
    Song Xue, Siyu Zhang, Yongfeng Liu. Quality Assessment of Hyperspectral Super-Resolution Images[J]. Laser & Optoelectronics Progress, 2019, 56(4): 041001
    Download Citation