
Xilong Yuan, Todd Darcie, Ziyin Wei, J Stewart Aitchison. Microchip imaging cytometer: making healthcare available, accessible, and affordable[J]. Opto-Electronic Advances, 2022, 5(11): 210130
- Opto-Electronic Advances
- Vol. 5, Issue 11, 210130 (2022)
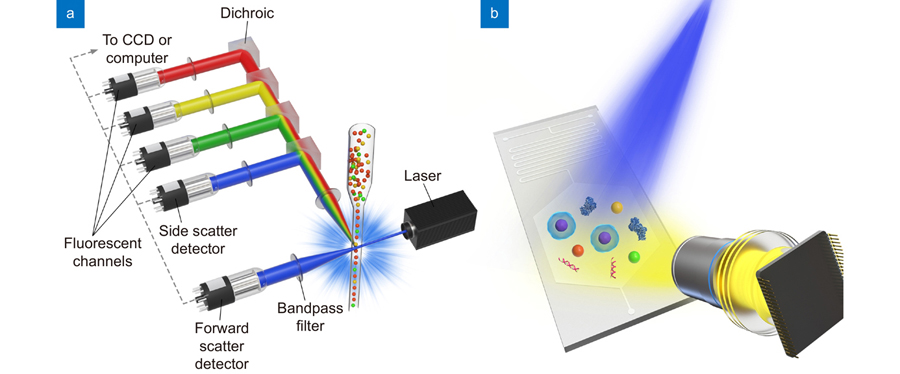
Fig. 1. Schematic of (a ) the sheath fluid-assisted flow cytometer and (b ) the Microfluidic Imaging Cytometer.
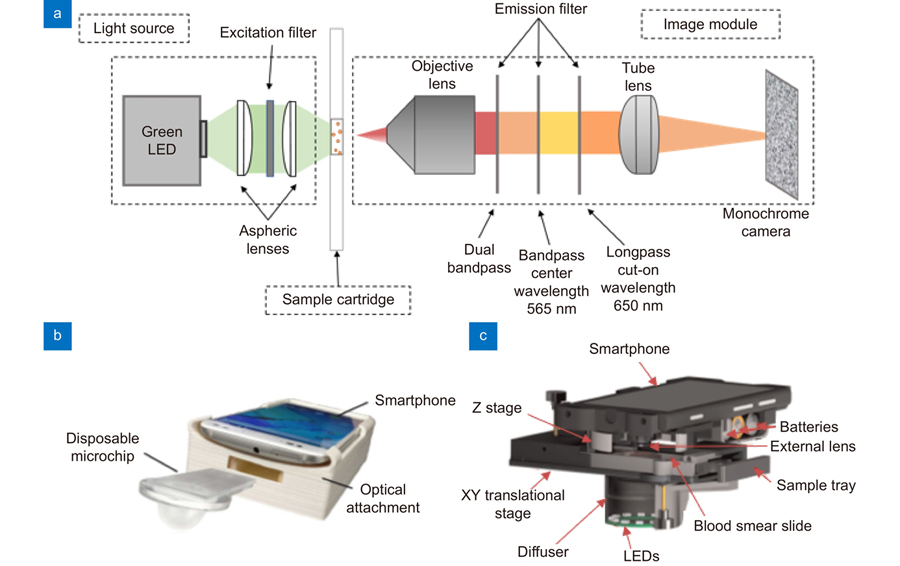
Fig. 2. Schematics and photographs for MIC devices with clinical application in (a ) immunoassay, (b ) semen analysis, (c ) sickle cell disease screening. Figure reproduced with permission from: (a) ref.64, IEEE; (b) ref.67, The American Association for the Advancement of Science; (c) ref.71, under a Creative Commons Attribution 4.0 International License.
Fig. 3. (a ) A photograph of an injection molded microfluidic chip with a bellows membrane to actuate the fluids. (b ) A prototype microfluidic chip with serpentine resuspension regions and a reagent plug installed. (c ) A photograph of a microfluidic reagent cassette containing pre-stored reagents. The microfluidic reagent cassette is part of a smartphone dongle for the testing of biomarkers such as HIV and syphilis antibodies. (d ) The sequence of flow through the test cassette. From the inlet, fluids move through each detection zone sequentially, then flowing into a waste pad. (e ) A schematic and (f ) a photograph of a microfluidic chip for measuring CD64 expression cells from whole blood. The microfluidic structures were fabricated with sedimentation serpentine lanes and cell capture chambers with vertical posts. Figure reproduced with permission from: (a, b) ref.61, Open Access; (c, d) ref.75, The American Association for the Advancement of Science; (e, f) ref.76, Royal Society of Chemistry.
Fig. 4. (a ) The schematic of an episcopic fluorescence microscope. (b ) A volume holographic grating-based multi-color fluorescence microscope. Figure reproduced with permission from (b) ref.89, © The Optical Society.
Fig. 5. (a ) Snap-on module for a smartphone consisting of an LED powered by a coin battery, a pinhole for uniform illumination with partial coherence, and a sample mount. (b ) The smartphone’s camera is used to record diffraction images of the specimen. The recorded images are transferred to a server via the cloud service for real-time image reconstruction and analyses, which can be returned to the smartphone in less than 2 min. (c ) Lens free-imaging approach using illumination at primary RGB wavelengths simultaneously. Relative depths of the hologram planes used for phase retrieval. (d ) Multi-wavelength phase retrieved amplitude images are placed into the RGB channels of a color reconstructed image. Figure reproduced with permission from: (a, b) ref.107, PNAS; (c, d) ref.108 © The Optical Society.
Fig. 6. (a ) Illustration of TDI capture mode. The CCD’s delay time is matched with the cell’s velocity in the flow cell as it traverses the length of the camera’s field of view, providing an integrated readout of the cell’s fluorescent emission. Different spectral components originating from multiple fluorescent markers are separated horizontally along with the columns of the CCD. (b ) Cell’s fluorescence spectrally resolved via the spectrograph. Figure reproduced with permission from ref.111, Copyright 2019 American Chemical Society.
Fig. 7. Temporally coded excitation fluorescence microscope. (a ) Chopper wheel that modulates the fluorescence excitation with a pseudo-random code. (b ) Cells travel through a microfluidic device and the fluorescence emission is imaged by a microscope (0.65 NA, 40×) and recorded onto a camera. (c ) Blur encoded images are captured by the camera and computationally decoded to produce near-diffraction-limited images. Figure reproduced with permission from ref.113, under Optica Open Access Publishing Agreement.


Set citation alerts for the article
Please enter your email address

© Copyright 2018-2021 | Chinese Laser Press. All Rights Reserved 沪ICP备15018463号-20