Abstract
The Microchip Imaging Cytometer (MIC) is a class of integrated point-of-care detection systems based on the combination of optical microscopy and flow cytometry. MIC devices have the attributes of portability, cost-effectiveness, and adaptability while providing quantitative measurements to meet the needs of laboratory testing in a variety of healthcare settings. Based on the use of microfluidic chips, MIC requires less sample and can complete sample preparation automatically. Therefore, they can provide quantitative testing results simply using a finger prick specimen. The decreased reagent consumption and reduced form factor also help improve the accessibility and affordability of healthcare services in remote and resource-limited settings. In this article, we review recent developments of the Microchip Imaging Cytometer from the following aspects: clinical applications, microfluidic chip integration, imaging optics, and image acquisition. Following, we provide an outlook of the field and remark on promising technologies that may enable significant progress in the near future.The Microchip Imaging Cytometer (MIC) is a class of integrated point-of-care detection systems based on the combination of optical microscopy and flow cytometry. MIC devices have the attributes of portability, cost-effectiveness, and adaptability while providing quantitative measurements to meet the needs of laboratory testing in a variety of healthcare settings. Based on the use of microfluidic chips, MIC requires less sample and can complete sample preparation automatically. Therefore, they can provide quantitative testing results simply using a finger prick specimen. The decreased reagent consumption and reduced form factor also help improve the accessibility and affordability of healthcare services in remote and resource-limited settings. In this article, we review recent developments of the Microchip Imaging Cytometer from the following aspects: clinical applications, microfluidic chip integration, imaging optics, and image acquisition. Following, we provide an outlook of the field and remark on promising technologies that may enable significant progress in the near future.Introduction
The flow cytometer is routinely used as a high-throughput, analytical instrument for counting and analyzing cells and particles. A typical application of a flow cytometer is to diagnose hematopoietic stem cell and lymphocyte-related health disorders by counting and sorting specifically labeled cells. As a result, it has become an indispensable tool in clinical laboratories for the diagnosis and monitoring of diseases such as Acquired Immunodeficiency Syndrome (AIDS), Leukemia, Lymphoma, and autoimmune diseases1-
10. Although a flow cytometer is a critical tool in clinical diagnosis, only large hospitals and centralized regional laboratories are equipped with such instruments11-
14. This is due to the relatively high cost, physical size, and intensive training required for the operation and maintenance of these instruments. As a result, many emerging testing needs are not met because of the lack of access to flow cytometry testing facilities and resources15. For example, platelet counting and cytokine testing can be used for the rapid screening and stratification of infectious diseases such as the currently ongoing pandamic16-
19. Therefore, the development of portable cytometers promises to fill these gaps in clinical diagnosis and improve the availability, accessibility, and affordability of laboratory testing procedures20-
25. In turn, the healthcare needs for an aging population, people in remote areas, and people in resource-limited settings could be better satisfied.
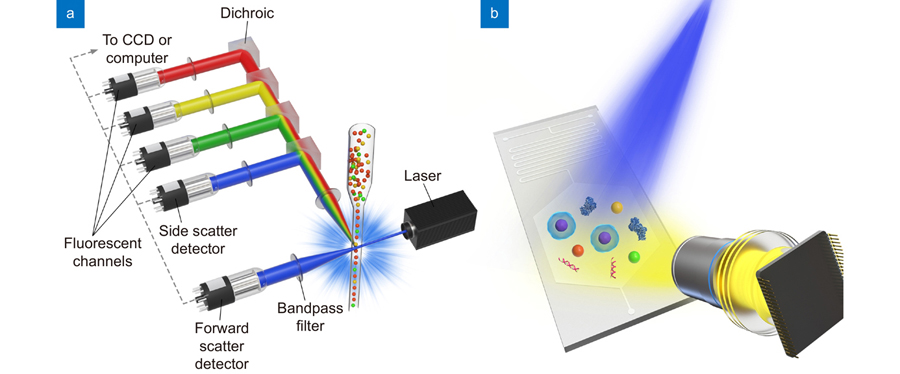
A conventional flow cytometer consists of three major components: fluidics, optics, and electronics (shown in
Fig. 1(a)). When a sample flows through the flow cell, the sheath fluid helps generate a tightly controlled stream of cells or particles, which are individually interrogated by the laser beam26. This fluidic process is known as hydrodynamic focusing. The scattered and fluorescent light produced from the cells/particles are collected through a series of lenses and filters and are detected by photomultiplier tubes (PMTs) or avalanche photodiode detectors (APDs). The PMTs convert the incoming photons of light into a photoelectric current, which is measured and digitized to generate a listmode file containing measurement values of each cell/particle. Because of the complex and sophisticated architecture of a traditional flow cytometer, it is expensive to acquire and maintain, and it often has a large form factor. Hydrodynamic focusing may require regulated pressure source for both the sheath and sample containers. Laser sources, filters, and PMTs all have a significant footprint in a traditional flow cytometer.

Figure 1.Schematic of (a) the sheath fluid-assisted flow cytometer and (b) the Microfluidic Imaging Cytometer.
The development of portable cytometers is generally focused on the minimization of the fluidic, optical, and electrical components. To simplify the fluidics system, portable cytometers tend to avoid the hydrodynamic focusing module and use microfluidic approaches to miniaturize the form factor27. Some devices may not have an active pumping module to further simplify the fluidic component. Depending on the design and application of certain portable cytometers, bright-field imaging, fluorescence imaging, and lens-free imaging have all been demonstrated in portable cytometry applications28-
31. The detection component of these “imaging cytometers” may contain standalone CCD or CMOS sensors or make use of the camera sensors in smartphone devices. These components replace the photomultiplier tubes or avalanche photodiode detectors used in conventional flow cytometers. To generate test results at the point of care, portable cytometers need to perform rapid image/video processing and computation. In comparison, conventional flow cytometers generate a standard data file (FCS) for further analysis by trained personnel. Therefore, the design and development of microchip imaging cytometers (MICs) have attracted broad interest from academia and industry.
Figure 1(b) shows an illustration of a typical MIC system.
While the emphasis on portability is a more recent subject of interest, the concept of ‘imaging flow cytometry’ has developed in parallel with ‘flow cytometry’ for decades32-
36. Imaging flow cytometry has similar high-throughput and multi-channel characteristics as conventional flow cytometry, but it can also provide the morphological and spatial information of cells and organelles. Therefore, conventionalimaging flow cytometry is suited for the analysis of rare cell types, such as circulating tumor cells. In this review, we focus on the discussion of microchip imaging cytometer (MIC) technologies designed for emerging point-of-care (POC) testing applications. The development of conventional imaging flow cytometry has been reviewed extensively, and readers may find the review articles from Barteneva, Doan, and Stavrakis interesting37-
39. Exhaustive reviews and research articles about other point-of-care testing technologies were published in recent years40-
52. The incorporation of microfluidic devices in qualitative, quantitative and digital nucleic acids testing has been reported in POC applications53-
55. These publications highlight the representative advances in POC testing technologies and they demonstrate the significance of POC testing technologies in the future development of the healthcare sector.
In this review article, an overview of the clinical applications of the Microchip Imaging Cytometer will be provided in the context of precision medicine and accessible healthcare. Developments in microfluidics, imaging optics, and image acquisition will be discussed. Emerging technologies such as multiplexed testing, lens-free imaging, and smartphone-enabled systems will be discussed to reflect the trends in the field. Lastly, the review summarizes the current developments and challenges and provides an outlook of the Microchip Imaging Cytometer field.
Clinical applications
Precision medicine initiatives seek to redefine prevention and treatment strategies and take individual variability into account, by developing large-scale biological databases and computational tools for analyzing sets of data. Therefore, point-of-care testing devices such as MIC may potentially provide critical real-time testing data and facilitate the deployment of more precise prevention and treatment strategies. On the other hand, although significant progress has been made in medical technologies in the past several decades, improvements in accessible and affordable healthcare services still fall behind in rural communities and resource-limited settings. Point-of-care technologies in primary care, the home, and emergency medical services may improve healthcare resource inequality and meet pressing clinical needs56,
57.
Different clinical applications may require simple cell counting, fluorescence intensity measurement, or morphological/spatial analysis58,
59. Notable applications of MIC include the monitoring of HIV-infected patients, the diagnosis of sickle cell disease, infectious diseases diagnosis, early cancer diagnosis, etc1-
9. Our group has focused on the development of MIC diagnostic devices and systems for HIV infection, Dengue fever, and Sepsis. Dou et al. reported a handhold CD4 cell detection device for HIV-infected patient monitoring60-
63. The device could complete the cell counting analysis within 15 minutes directly from a single finger prick blood sample. The limit of detection of the system was determined to be 6400 Molecules of Equivalent Soluble Fluorochrome (MESF, phycoerythrin, PE) units. The demonstrated system showed satisfactory accuracy and linearity for CD3/CD4 counting by comparing the values acquired from traditional flow cytometers. Our group also reported multiplexed detection of protein biomarkers using custom-developed MIC systems64-
66. A bead-based assay for the detection of one of the four serotypes of dengue virus non-structural protein (DENV-NS1) as well as its cognate human IgG was developed. The fluorescent microspheres containing the classification fluorophore and detection fluorophore were imaged through a microfluidic chip using an infinity-corrected microscope system. Calibration curves for the median fluorescence intensity against known concentrations of DENV-NS1 protein and anti-NS1 human IgG were reported. The limit of quantitation was 7.8 ng/mL and 15.6 ng/mL, respectively. In subsequent work, we demonstrated a light-emitting diode (LED)-excited imaging cytometer for the detection of bead-based immunoassay samples for procalcitonin, a sepsis biomarker. A broad area green LED illuminates the specimen plane using a set of aspheric lenses and an excitation filter (
Fig. 2(a))64. Experimental results demonstrated that the LED light source provides more uniform illumination across the specimen plane, and therefore permits the multiplex detection of three biomarkers. The imaging cytometer can detect procalcitonin at concentration as low as 24.4 pg/mL.
Figure 2.Schematics and photographs for MIC devices with clinical application in (a) immunoassay, (b) semen analysis, (c) sickle cell disease screening. Figure reproduced with permission from: (a) ref.64, IEEE; (b) ref.67, The American Association for the Advancement of Science; (c) ref.71, under a Creative Commons Attribution 4.0 International License.
Kanakasabapathy et al. reported an automated point of care semen analysis system for quantitative measurement of sperm concentration and motility for infertility screening (
Fig. 2(b))67. Gordon et al. reported that a portable, multimodal microscope can successfully resolve features necessary for detecting parasites (e.g. P. falciparum) in bright-field, fluorescence, and cross-polarized modalities68. Zhu et al. reported an optofluidic fluorescent imaging cytometry on a cellphone for the rapid counting and analysis of labeled particles/cells (e.g., monitoring of HIV-infected patients). A spatial resolution of ~ 2 μm is demonstrated in the portable imaging system69. Wei et al. demonstrated the detection of CD4 and CD8 cells using the lens-free holographic microscopy enhanced by plasmonic nanoparticles. Cellular-specific contrast on the lens-free imaging platform over a field-of-view (~ 24 mm2) was achieved by first measuring the resonant optical properties of labeled cell lines with multispectral lens-free holographic imaging, and second, automatically recognizing the spectral patterns by statistical analysis and machine learning70. Recently, De Haan et al. reported the screening of sickle cell disease in blood smears using a smartphone-based microscope and deep learning (
Fig. 2(c))71. A blind test for mobile sickle cell detection was performed from 96 unique patients (including 32 sickle cell disease patients) using the smartphone microscope, and it achieved an accuracy of ~98%, with an area-under-the-curve of 0.998. These advances demonstrate the essential role of microchip imaging cytometry analysis in disease prevention, diagnosis, and monitoring.
Microchip technologies
Microchip (i.e., microfluidic chip) technologies are the central elements of MIC systems. An ideal MIC system should achieve sample collection/preparation, signal detection/processing, and result analysis in one device. Compared with conventional fluidic delivery and control approaches, microchip technologies possess several advantages. For example, 1) microfluidic devices should integrate complex fluidic processing functions in a very compact form; 2) microfluidic devices process a significantly smaller volume of fluidic samples and therefore they may effectively reduce the cost of reagents and supplies; 3) microfluidic chips may be rapidly prototyped using modular microfluidic platforms. On the other hand, the deployment and commercialization of microfluidic technologies in healthcare have been slow due to several factors: 1) the development time of integrated microfluidic system is relatively long because of the excessively long cycle of design, fabrication, testing, and validation; 2) complex microfluidic chip prototypes remain expensive to fabricate in smaller scale and a certain prototype chip usually requires modification to adapt specific application needs. To address these challenges, standardized and modular microfluidic platforms are attracting increased attention from academic research and industrial development72-
74. Microfluidic building blocks and interconnects have been designed based on a bottom-up function-centered strategy, and then stored in a library for future use. Such a library of reusable and interoperable microfluidic building blocks could potentially fill the gap between lab and fab, as it reduces the time-to-market by reducing prototype cycles and improving the transferability of existing microfluidic units.
An ideal integrated MIC system may contain the following units: sample introduction unit, reagent storage unit, mixing and processing unit, and detection/imaging unit. Depending on the level of automation and image capturing formats, we classify MIC devices into three approaches: Static-chip-static-fluid (SCSF), Static-chip-moving-fluid (SCMF), and Moving-chip-static-fluid (MCSF). SCSF approach requires that samples and reagents be processed separately and dispensed into a microfluidic channel for imaging. Because neither the microfluidic chip nor the fluid move, the amount of image data to be captured is dependent on the field of view of the imaging system and it requires separate sample processing from a trained technician. The SCMF approach requires that a cell or particle specimen be continuously pumped through microfluidic channels when the cell/particles are detected. Therefore, the sample preparation and/or fluidic delivery unit must be integrated within the MIC system to achieve a higher level of automation. This approach has sophisticated requirements for fluidic delivery and control; however, it may achieve automated high-throughput processing and analysis of cell and particle specimens. Notably, moving cells or particles may produce light trails in captured images, and the stretched images depend on the flow rate of the cell/particle object. These characteristics demand more robust image processing algorithms to extract relevant morphology or intensity information from the captured images. The MCSF approach requires separate sample preparation and loading units, and it contains motorized stages to control the movement of the microfluidic chip assembly. This approach could potentially capture images from several channels and areas of the microfluidic chip, therefore improving the imaging throughput. Compared with the SCMF approach, the MCSF approach may capture images with higher sensitivity and resolution because of the static nature of the cells/particles.
Our group has focused on the development of MIC systems using different microfluidic approaches. Dou et al. reported a CD4 counting device, demonstrating the Static-chip-moving-fluid (SCMF) approach61.
Figure 3(a) shows a picture of an example microfluidic cartridge used in the CD4 counting device. A bellows pump was used to actuate the dispense/delivery of sample and reagent fluids. A soft elastomer membrane was used as the pneumatic interface between the microfluidic chip and the actuation motor.
Figure 3(b) shows a picture of a prototype microfluidic chip with serpentine mixing channels and a reagent plug installed. The active actuation combined with curved microfluidic channel structures was designed to enhance mixing efficiency. In another work, we demonstrated the moving-chip-static-fluid (MCSF) approach for capturing images of a bead-based immunoassay detection device65. The demonstrated approach could capture 60 images of a 1.0 mm × 1.0 mm frame in a typical straight microfluidic detection channel (1.0 mm × 60 mm).
Figure 3.(a) A photograph of an injection molded microfluidic chip with a bellows membrane to actuate the fluids. (b) A prototype microfluidic chip with serpentine resuspension regions and a reagent plug installed. (c) A photograph of a microfluidic reagent cassette containing pre-stored reagents. The microfluidic reagent cassette is part of a smartphone dongle for the testing of biomarkers such as HIV and syphilis antibodies. (d) The sequence of flow through the test cassette. From the inlet, fluids move through each detection zone sequentially, then flowing into a waste pad. (e) A schematic and (f) a photograph of a microfluidic chip for measuring CD64 expression cells from whole blood. The microfluidic structures were fabricated with sedimentation serpentine lanes and cell capture chambers with vertical posts. Figure reproduced with permission from: (a, b) ref.61, Open Access; (c, d) ref.75, The American Association for the Advancement of Science; (e, f) ref.76, Royal Society of Chemistry.
Laksanasopin et al. reported a microfluidic smartphone dongle for the diagnosis of infectious diseases at the point of care75. The device uses a “one-push vacuum,” where a user mechanically activates a negative pressure chamber to move reagents. The microfluidic dongle is designed to perform a full laboratory-quality immunoassay, which incorporates mechanical, optical, and electronic functions. Reagents were pre-stored in a microfluidic cassette for the point-of-care sample loading and processing (
Fig. 3(c) and
3(d). Ozcan et al. reported several MIC devices based on the SCSF and SCMF approaches69,
71,
76. With the adoption of lens-free imaging techniques, these approaches can also achieve a large field of view without the need to move the microchip assembly67. Different microfluidic chip substrates were reported, such as PDMS, PDMS-glass hybrid chip, and glass smear chip. Ghonge et al. demonstrated a smartphone-based microfluidic imaging cytometer for measuring CD64 expression from whole blood76. As shown in
Fig. 3(e) and
3(f), microfluidic structures were fabricated with serpentines lanes for white blood cell sedimentation, and with vertical pillars in the cell capture chambers. Unprocessed whole blood is injected into a capture chamber to achieve immunological capture of neutrophils with CD64 expression (nCD64). A staggered array of pillars was previously functionalized with an antibody against CD64 in the cell capture chamber. Then, an image of the capture channel is taken using a smartphone-based microscope. This image is used to measure the fraction of captured nCD64 cells allowing sepsis conditions to be monitored. Recently, Poudenih et al. demonstrated a highly integrated glucose and insulin detection system with the SCMF approach77. A blood specimen is delivered into a microfluidic chip via a peristaltic pump. The microfluidic chip contains mixing, depletion, and detection units. The mixing unit allows the blood specimen to be incubated with capture beads. The depletion unit separates the capturing beads with irrelevant blood cells through size-based separation (Deterministic Lateral Displacement, DLD)78. Finally, the fluorescence-labeled beads are introduced in the detection unit for imaging and further analysis.
Microfluidic technologies play an indispensable role in the design and implementation of MIC systems. Depending on the application requirements such as testing throughput, sensitivity, image feature extraction fidelity, microchip-imaging approaches (SCSF, SCMF, MCSF) will find diverse applications in POC testing. Furthermore, we predict that modular and standardized microfluidic building blocks will be increasingly adopted by researchers and engineers.
Imaging optics
Brightfield imaging
Although flow cytometry generates high-content cellular information through scattering and fluorescence signals, microscopic imaging tools are still indispensable in routine laboratory testing. Cell size, morphology, and location of labeled molecules within cells can be determined using a standard bright-field microscope. Bright-field microscopy for point-of-care applications has undergone an extended period of development68,
79-
81. From the McArthur folded optical microscopy to the subsequent innovations (e.g., ReadiView, Trekker), bright-field microscopy tools have played essential roles in disease diagnosis80. For example, a sizable portion of tropical diseases are routinely diagnosed by microscopic examinations of either blood, stool, or urine samples.
The rapid evolution of smartphone devices and related technologies also facilitates the research and development of point-of-care bright-field microscopy tools. Of particular interest, each generation brings faster processors, more sensitive cameras, and improved image processing algorithms. Exploiting these benefits, Chen et al. demonstrated a bright-field smartphone imaging technique for quantifying ultra-low concentrations of protein biomarkers82. An ultra-sensitive microbubbling assay was performed to detect prostate-specific antigen (PSA) and β subunit of human chorionic gonadotropin (βhCG). Machine learning was used to facilitate accurate and robust processing from within a smartphone application. Jagannadh et al. demonstrated a microfluidics-based portable imaging flow analyzer for automated cell viability assessment83. A cellphone microscope attachment for housing the optics and the replaceable microfluidic cartridge was reported. The research demonstrated an enhanced throughput of about 450 cells per second with the use of a closely-spaced, multiple-channel geometry. Because bright-field microscopy devices typically require fewer optical components than fluorescent systems, the cost and ease of use are more amenable to point-of-care applications. Therefore, point-of-care bright-field microscopy devices will continue to find broad applications in disease diagnosis.
Fluorescence imaging
Fluorescence is a sub-type of photoluminescence, which is a process in which susceptible molecules emit light from excited electronic states that are generated after absorbing light at a different wavelength. Usually, the absorption occurs in ultraviolet or visible wavelengths. Fluorescent molecules can generate light that is spectrally separated from the pump (or excitation) source due to the Stokes shift from excitation band to emission band. In contrast to phosphorescence, fluorescence is usually characterized by a much shorter excited state lifetime (<10–5 s compared to seconds or minutes)65,
84. As a result, fluorescence is typically much stronger than phosphorescence, but it only persists while the excitation light is present. However, the intensity of the fluorescent emission signal is still several orders of magnitude weaker than the excitation intensity in most systems. Because of the high sensitivity and specificity of fluorescent labels, fluorescence-based detection is one of the most important detection and tracking techniques in chemical and biological analysis. Cellular and molecular information that can be acquired via fluorescent labels include protein expression level, nucleic acid identification, immune cell expression, etc.
The episcopic microscope is the most used fluorescence imaging system.
Figure 4(a) shows a typical schematic of an episcopic fluorescence imaging system. The excitation beam is reflected by the dichroic mirror and transmitted through the objective lens. The fluorescence light is collected by the same objective lens and the image transmits through the dichroic mirror. An emission filter is placed before the detector to block any residual excitation light, which can have intensity several orders of magnitude above that of the fluorescent emission. Some advantages of the episcopic microscope include high pump rejection (since the dichroic mirror separates the excitation and emission paths), and the ability to use Köhler illumination for improved illumination uniformity. Using the same microscope lens as both an objective and condenser can be seen as either an advantage or a disadvantage. For ultraviolet excitation, more expensive quartz objectives must be used. For portable cytometry, the episcopic microscope system can be greatly simplified or substituted for an in-line configuration, but a filter of some kind must still be employed to block or separate the residual excitation light. Arguably the simplest optical configuration can be obtained by using lens-free fluorescent imaging techniques, which will be discussed in the following section.
Figure 4.(a) The schematic of an episcopic fluorescence microscope. (b) A volume holographic grating-based multi-color fluorescence microscope. Figure reproduced with permission from (b) ref.89, © The Optical Society.
The spectral separation and short lifetime of fluorescent molecules also enable various multiplexing schemes for biomarker detection, therefore improving diagnostic accuracy and providing more information about the state of the patients42,
85-
88. Depending on the multiplexing method, fluorescence imaging cytometry can be classified into spectral multiplexing, intensity multiplexing, and temporal multiplexing. Spectral multiplexing identifies the analyte by its emission spectrum. Chia et al reported optical sectioning fluorescence microscopy using the spectral multiplexing method89. As shown in
Fig. 4(b), the volume holographic grating separates green and red fluorescent signals, which are projected onto different areas of a CCD. The spatial separation of the emission light path gives multicolor images simultaneously while using only a greyscale CCD. A high contrast image is produced by combining the high and low spatial frequency components, which are extracted from a uniformly illuminated image and a speckle illuminated image.
In intensity multiplexing, two or more different biomarkers are each assigned to signature concentrations of a fluorescent marker, which translate into different fluorescence intensities in a certain spectral channel (referred to as a “classification channel”). A different, spectrally separated fluorescent marker is then used to detect the concentration of each analyte through the intensity of in the “detection channel”. Yuan et al demonstrated a bead-based intensity multiplexing imaging system that can classify and quantitatively analyze NS1 and anti-NS1 IgG, which are important biomarkers for dengue diagnosis. The beads are dyed with two allophycocyanin (APC) concentrations which act as unique barcodes. The beads with high APC concentration were coupled with the anti-DENV-NS1 specific synthetic antibody to capture DENV-NS1 protein, while the beads with low APC concentration were coupled with DENV-NS1 to capture anti-DENV-NS1 IgG antibodies. The analyte concentration can be obtained from the fluorescent intensity of phycoerythrin, which binds to the immune complex through a biotin-streptavidin interaction65.
Temporal multiplexing is based on the different lifetimes of the fluorophores. Kage et al demonstrated a lifetime multiplexing flow cytometry with a channel that measures the fluorescence decay and three channels that measure the scattered light intensity90. Compared with spectral and intensity multiplexing, temporal multiplexing is less affected by autofluorescence91,
92. Quantum dot and lanthanide probes are often used because of their long lifetime and high photobleaching resistance93. However, lifetime imaging requires a time synchronization system that brings up the cost and volume of the device94. Recent advancements in CMOS technology may help the miniaturization of the device and open new possibilities to point-of-care applications95.
In addition to the development of multi-spectral imaging in cell analysis, hyperspectral imaging finds broad biomedical applications by combining imaging and spectroscopy modalities96. Hyperspectral imaging microscopy permits the capture and identification of different spectral signatures present in an optical field during a single-pass evaluation, including molecules with overlapping but distinct emission spectra. Information is stored and processed as a series of spectral images and is typically used to analyze cells and other biomedical specimens. There are many ways of describing hyperspectral imaging techniques, such as by spectral range, spectral resolution, and the type of dispersive device. Because of the high-content images acquired from hyperspectral techniques, rich cytometric information can be generated from cell and particle analysis results. Therefore, hyperspectral imaging systems may be developed for point-of-care cytometric applications whereas more compact dispersion optics, faster image acquisition, and smarter image processing methods are required97,
98.
Lens-free imaging
Many of the previously mentioned approaches involve the miniaturization of the optical system required to image a microfluidic chip onto an image sensor. Over the last decade, lens-free (or lensfree, lensless) imaging has emerged as a lightweight, compact, and low-cost approach to cell analysis which eliminates the need for most of these optical components. The absence of objective lenses and other optical components which limit the system aperture can also increase the available field of view (which is limited only by the size of the image sensor). While conventional benchtop microscopes usually have a FOV on the order of mm2, Seo et al. demonstrated a lens-free imaging cytometry system with a FOV of 10 cm299. This makes lens-free cytometry particularly well suited for high throughput analysis of large cell populations in a single acquisition100.
Without using conventional imaging optics, the sensor can only obtain indirect spatial information from the sample, such as the diffraction pattern. However, when sources with sufficient spatial and temporal coherence are used, there is a rich literature of phase-retrieval algorithms developed for digital in-line holography (DIH) and holographic microscopy (DIHM) that can be used to reconstruct the original images of the sample. DIHM conventionally uses a monochromatic laser source that passes through a small pinhole (e.g., 1 μm diameter), followed by free-space propagation of a few millimeters to the sample plane. If the distance between the sensor and the sample plane (z2) is greater than the distance between the pinhole and the sample plane (z1), the fringes will be magnified by a factor of M = (z1 + z2)/z1101. Due to this magnification, a sample resolution of < 1 μm can be achieved 102.
In the absence of coherent illumination (e.g., using an extended, white-light source), phase retrieval algorithms cannot be used, but other techniques can often be employed to coarsely identify the spatial signature of the cell, which is referred to as a “shadow”. This limited information can still be of use in high-throughput cytometry, for instance, where detailed structural information is often not required. Also, since the sample is placed close to the sensor plane (z1 << z2), incoherent lens-free microscopy is advantageous for maximizing the field of view. One of the initial demonstrations was termed “Lensless, Ultra-wide-field Cell monitoring Array platform based on Shadow imaging” (LUCAS)103. In the original LUCAS technique, cells are positioned on a slide or in a microfluidic channel which is illuminated with a white-light source. After propagating for 0.2 mm, the “shadow” pattern is recorded on a CCD sensor. As a more recent example, Lee et al. demonstrated an optofluidic microscope which weakened the shadow-imaging diffraction by reducing the distance between the cells (which were flowing through a microfluidic channel) and the CMOS sensor to under 2 μm104. To further improve the spatial resolution, the researchers employed a multi-frame super-resolution algorithm based on the sub-pixel movement of cells within the channel. Since this technique does not require a coherent source, they were also able to apply similar processing to a smartphone-based system that used ambient illumination for bright-field, lens-free imaging105.
Due to their low cost and ease of packaging, LEDs have also been used as light sources for lens-free cytometry102,
103. Even using a partially coherent light source and a larger pinhole (0.1–1 mm), it can still be possible to perform lens-free holographic imaging. Due to the lower coherence, the sample must be placed closer to the sensor than in laser-based DIHM106. The lower coherence length of these LED cytometers also helps mitigate speckle and multiple-reflection interference effects which can introduce additional noise in DIHM images. Tseng et al. initially demonstrated a cellphone-based imaging cytometer based on partially coherent holography106. More recently, Im et al. combined bead-based assay and smartphone lens-free imaging to develop a portable diagnostic device, which is shown in
Fig. 5(a)107. In this system, a pinhole diameter of 100 μm was used and the distance between the sensor and the pinhole was 28 mm. Using cloud-based reconstruction and classification routines (
Fig. 5(b)), the authors were able to demonstrate not only cancer cell counts but also measure the expression levels of three molecular markers associated with cervical cancer107.
Figure 5.(a) Snap-on module for a smartphone consisting of an LED powered by a coin battery, a pinhole for uniform illumination with partial coherence, and a sample mount. (b) The smartphone’s camera is used to record diffraction images of the specimen. The recorded images are transferred to a server via the cloud service for real-time image reconstruction and analyses, which can be returned to the smartphone in less than 2 min. (c) Lens free-imaging approach using illumination at primary RGB wavelengths simultaneously. Relative depths of the hologram planes used for phase retrieval. (d) Multi-wavelength phase retrieved amplitude images are placed into the RGB channels of a color reconstructed image. Figure reproduced with permission from: (a, b) ref.107, PNAS; (c, d) ref.108 © The Optical Society.
While holographic image reconstruction is usually limited to quasi-monochromatic imaging, Marien et al. demonstrated simultaneous RGB imaging using the approach shown in
Fig. 5(c) and
5(d)108. Rather than using sequential illumination and reconstruction at three different wavelengths, the sample is illuminated with all three wavelengths at the same time. While the reconstruction distance for the hologram acquired at a given wavelength is fixed, holograms acquired at other wavelengths can be reconstructed as if they were in a plane at a larger or smaller reconstruction depth. Using this principle, the phase reconstruction can be achieved iteratively at all three wavelengths by virtual z-stepping between holographic planes.
Image acquisition techniques
One of the key challenges with SCMF and MCSF type Microchip Imaging Cytometry is the acquisition, storage, and processing of potentially large quantities of cell images. During image acquisition, there is a trade-off between sensitivity, information, and acquisition speed (which limits the throughput of the device). Increasing the relative flow velocity requires that the exposure time be decreased to avoid blurring, resulting in fewer photons reaching each pixel of the CMOS or CCD detector. This can be especially harmful to imaging at low light levels, either using conventional bright-field microscopy or weak fluorescent imaging. While pulsed illumination from ultrafast lasers can effectively eliminate motion blur, it is difficult to get enough light on the detector to achieve a strong signal-to-noise ratio109. However, the flow velocity can be increased by rearranging the pixels of the detector to work in parallel, either spatially or temporally.
Rather than acquiring the image from the entire pixel array of a CCD sensor simultaneously, the time delay integration (TDI) technique involves having multiple rows of pixels that shift their partial acquisition synchronously with the motion of a cell across the detector’s field of view. The incident photons collected by each pixel are stored as electric charge until the end of the line is reached, at which point the charge is accumulated within an amplifier before voltage readout. These specialized CCDs allow the exposure time of each pixel to be increased while avoiding motion blur110. The detector can also be further subdivided into several columns to simultaneously acquire images in multiple spectral ranges (
Fig. 6)111. Because the movement of the cell must be synchronized to the image acquisition, this technique requires a tightly controlled microfluidic system, which may limit its application in a portable device. It is also extremely sensitive to translation and rotation112.
Figure 6.(a) Illustration of TDI capture mode. The CCD’s delay time is matched with the cell’s velocity in the flow cell as it traverses the length of the camera’s field of view, providing an integrated readout of the cell’s fluorescent emission. Different spectral components originating from multiple fluorescent markers are separated horizontally along with the columns of the CCD. (b) Cell’s fluorescence spectrally resolved via the spectrograph. Figure reproduced with permission from ref.111, Copyright 2019 American Chemical Society.
Instead of using specialized detectors which employ temporal parallelization as in TDI, the multiple field of view imaging flow cytometer (MIFC) approach aims to increase throughput through spatial parallelization. This is done by using multiple parallel microfluidic channels, which are simultaneously imaged onto one detector. The degree of improvement is directly correlated to the number of channels, or isolated fields of view, which are imaged onto the detector112. Imaging of these channels can be done by adding a microlens array on top of the channels, or by using diffractive lenses. While microlens arrays offer superior broadband operation, diffractive lenses can be easily fabricated to tighter tolerances due to their 2D geometry, which is critical for high resolution112. Even under monochromatic illumination, the degree of parallelization is limited by field aberration in the diffractive lens.
Temporally coded excitation is yet another way to circumvent the trade-off between throughput and exposure time. In this technique, a chopper is used to modulate the excitation light with a pseudo-random code, as illustrated in
Fig. 7(a). The acquired images can then be computationally deblurred by using this known code along with the PSF of the imaging system (
Fig. 7(b) and
7(c)). Using this technique, fluorescence images of moving cells with exposure time up to 50 times the motion-blur limit can be reconstructed113. Since the velocity is found computationally, the reconstruction algorithm can also be modified to account for velocity variation in laminar flow.
Figure 7.Temporally coded excitation fluorescence microscope. (a) Chopper wheel that modulates the fluorescence excitation with a pseudo-random code. (b) Cells travel through a microfluidic device and the fluorescence emission is imaged by a microscope (0.65 NA, 40×) and recorded onto a camera. (c) Blur encoded images are captured by the camera and computationally decoded to produce near-diffraction-limited images. Figure reproduced with permission from ref.113, under Optica Open Access Publishing Agreement.
Future developments
Flow cytometry has been a routine method for laboratory tests and biological research. Meanwhile, the advances in microfluidics attract enormous interest in developing highly integrated and portable imaging cytometry systems for point-of-care applications. As far as we are concerned, Luminex has introduced imaging cytometry instruments such as Magpix® and Amnis® FlowSignt® for scientific and clinical use. More commercialization efforts are underway to bring new technologies and products to the healthcare and laboratory users. Recent advances in photonics, integrated optics, and imaging technologies promise to increase the sensitivity and functionality of such systems while decreasing their size and cost. Colors can be differentiated directly on the silicon CMOS image sensors using several techniques. Optical signals with different wavelengths can be absorbed at different depths in the sensor. The photocurrents produced by buried double and triple junctions can be used to separate wavelengths. Color differentiation can also be achieved by using the wavelength-dependent absorption properties of the polysilicon gate114. Such techniques lead to the ability to demultiplex the signals from several wavelength channels simultaneously while avoiding the need for interference filters to select the wavelength channel required. Progress towards higher sensitivity detectors has also been made by integrating single-photon avalanche diodes in standard CMOS with microfluidic systems115. This approach offers the prospect of imaging at the single-photon level with associated improvements in limit of detection. These demonstrations have proved the potential of Microchip Imaging Cytometry systems for laboratory analysis of cells and other biomarkers.
In summary, the development of MIC devices should focus on the following parameters: 1) the device should be portable to fit the diagnostic purpose in varying healthcare scenarios, 2) the device should be easy to use and provide sample-to-answer results rapidly (e.g. 15 minutes), 3) the microfluidic assembly should contain pre-loaded reagents and be disposable. Additionally, the analytical performance of MIC devices, such as sensitivity, accuracy, precision, robustness, needs to meet the certain testing requirements. In the process of instrument and reagent commercialization, all these parameters need to be considered. Therefore, engineering design and development need to find the sophisticated balance between complexity, performance and cost, to meet the needs in healthcare and to benefit more patients. Microchip Imaging Cytometry systems require more research and development efforts to improve the technology readiness level and facilitate deployment and commercialization. Facing the global challenges in healthcare and public health management, we anticipate more research and development efforts to be made to satisfy the needs for more available, accessible, and affordable healthcare.
References
[3] Lewandowski M E. The design, fabrication, and evaluation of mobile point-of-care systems for cellular imaging in microfluidic channels. (Case Western Reserve University, Cleveland, 2018).
[61] Dou JJ. A miniaturized microfluidic cytometer platform for point-of-care blood testing applications. (University of Toronto, Toronto, 2017).
[62] Dou J, Chen L, Nayyar R, Aitchison JS. A miniaturized particle detection system for HIV monitoring. In 2013 IEEE Photonics Conference 5–7 (IEEE, 2013);http://doi.org/10.1109/IPCon.2013.6656338.
[66] Garg S, Yuan RX, Gopalsamy A, Fellouse FA, Sidhu SS et al. A multiplexed, point-of-care sensing for dengue In 2019 IEEE SENSORS 1–4 (IEEE, 2019);http://doi.org/10.1109/SENSORS43011.2019.8956616.
[94] Becker W. Advanced Time-Correlated Single Photon Counting Techniques (Springer, Berlin Heidelberg, 2005).