• Photonics Research
  • Vol. 3, Issue 6, 308 (2015)
Jianbin Huang, Xiaoshuai Liu, Yao Zhang, and Baojun Li*
Author Affiliations
  • State Key Laboratory of Optoelectronic Materials and Technologies, School of Physics and Engineering,Sun Yat-Sen University, Guangzhou 510275, China
  • show less
    DOI: 10.1364/PRJ.3.000308 Cite this Article Set citation alerts
    Jianbin Huang, Xiaoshuai Liu, Yao Zhang, Baojun Li. Optical trapping and orientation of Escherichia coli cells using two tapered fiber probes[J]. Photonics Research, 2015, 3(6): 308 Copy Citation Text show less
    Schemes for the experimental model and setup. (a) Experimental model. The point O is the intersection point of two fiber probes at which the E. coli cell will be trapped. (b) An E. coli cell chain was formed with a laser beam launched into probe I. (c) The E. coli cell is orientated along the axial of probe II when P2>P1. (d) The cell is orientated along probe I when P1>P2. (e) Experimental setup. Insets I and III indicate the optical microscope images of probe II and probe I, respectively. Inset II shows the scanning electron micrograph of the E. coli cells.
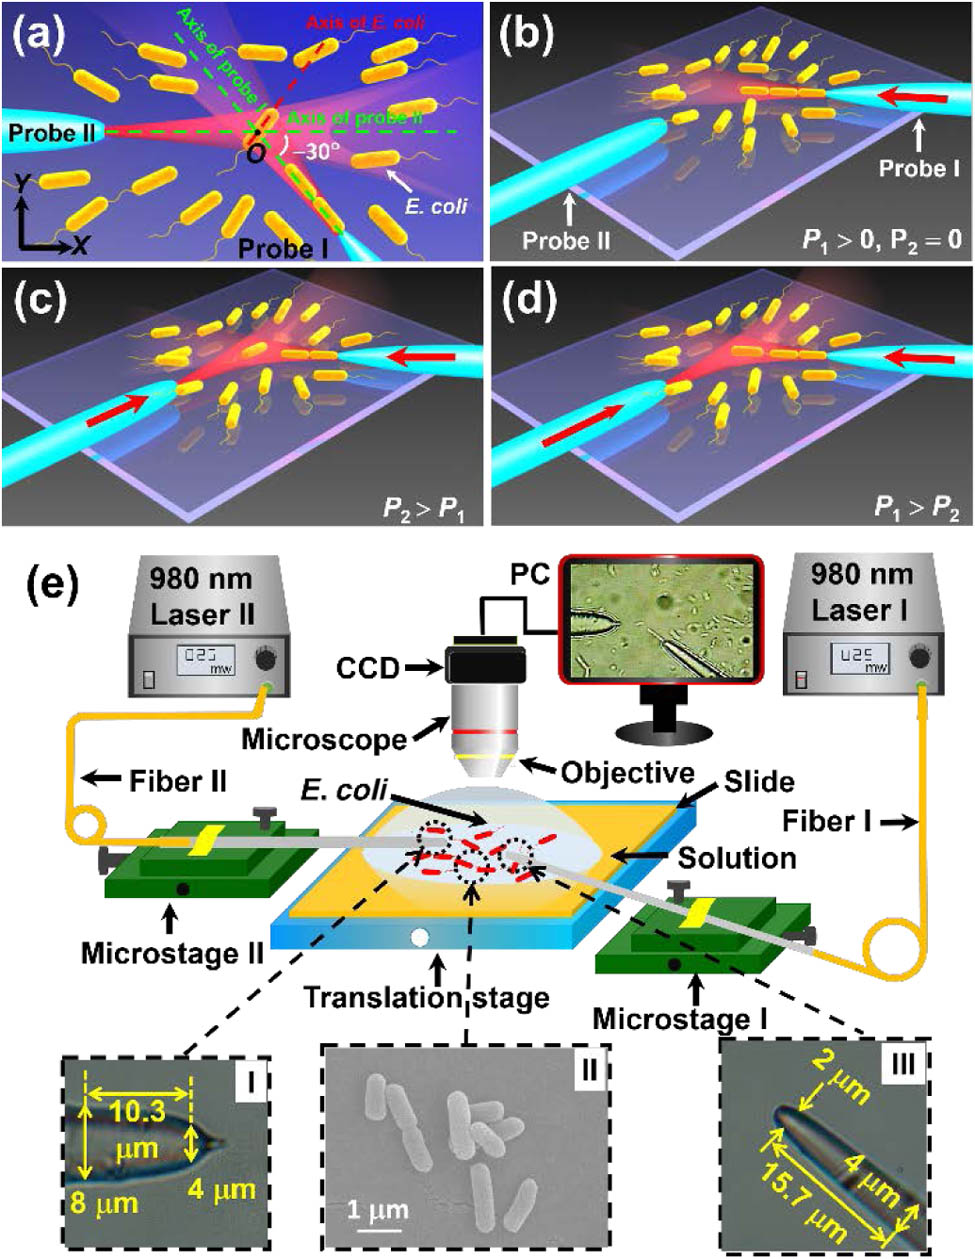
    Fig. 1. Schemes for the experimental model and setup. (a) Experimental model. The point O is the intersection point of two fiber probes at which the E. coli cell will be trapped. (b) An E. coli cell chain was formed with a laser beam launched into probe I. (c) The E. coli cell is orientated along the axial of probe II when P2>P1. (d) The cell is orientated along probe I when P1>P2. (e) Experimental setup. Insets I and III indicate the optical microscope images of probe II and probe I, respectively. Inset II shows the scanning electron micrograph of the E. coli cells.
    Optical microscope images for trapping and orientation of the E. coli. (a) At t=0 s, turning on the 980 nm laser of 25 mW into probe I, the cells began to be trapped one after another. (b) At t=2 s, a cell chain consisting of three E. coli cells was connected to the tip of probe I. (c) At t=3 s, after a laser beam of 20 mW was injected into probe II, the last E. coli of the chain was pulled away from the chain. (d) At t=3.3 s, the angle between the axis of the E. coli and probe II (θ) was −19°. (e) At t=4.2 s, the input power of probe II was increased from 20 to 35 mW and the cell was orientated along probe II with θ of 0. (f) At t=6 s, the input power of probe II was decreased from 35 to 15 mW and the cell began to rotate. (g) At t=6.6 s, the cell was orientated along probe I with θ of −30°.
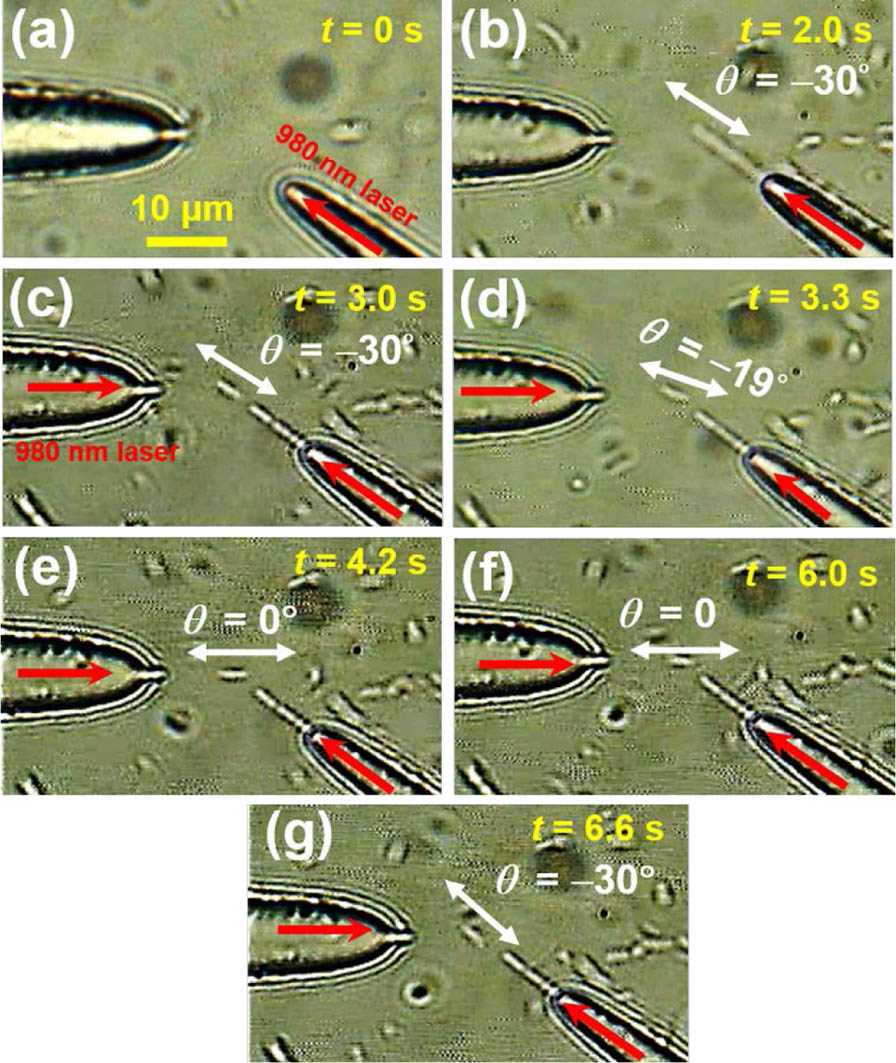
    Fig. 2. Optical microscope images for trapping and orientation of the E. coli. (a) At t=0s, turning on the 980 nm laser of 25 mW into probe I, the cells began to be trapped one after another. (b) At t=2s, a cell chain consisting of three E. coli cells was connected to the tip of probe I. (c) At t=3s, after a laser beam of 20 mW was injected into probe II, the last E. coli of the chain was pulled away from the chain. (d) At t=3.3s, the angle between the axis of the E. coli and probe II (θ) was 19°. (e) At t=4.2s, the input power of probe II was increased from 20 to 35 mW and the cell was orientated along probe II with θ of 0. (f) At t=6s, the input power of probe II was decreased from 35 to 15 mW and the cell began to rotate. (g) At t=6.6s, the cell was orientated along probe I with θ of 30°.
    Simulated distributions of energy density for the two probes. (a) Energy density distribution of probe I. (b) Energy density along the axis of probe I. (c) Energy density distribution of probe II. (d) Energy density along the axis of probe I.
    Fig. 3. Simulated distributions of energy density for the two probes. (a) Energy density distribution of probe I. (b) Energy density along the axis of probe I. (c) Energy density distribution of probe II. (d) Energy density along the axis of probe I.
    Optical forces and torques. (a) Optical torques and rotational potential energy as a function of azimuthal angle θ. The inset shows the calculation model. The E. coli is orientated with an angle θ to the axis of probe II. Point i indicates the arbitrary interaction point with a position vector ri from the central point of the E. coli. (b) Simulated energy density distributions for E. coli chains consisting of 1–4 cells. (c) Energy density distribution along the axis of probe II with cell numbers of 0, 1, 2, and 3. The points A, B, and C were the positions of the cell chain extremities. X=1.1 was the X coordinate of the point O. (d) Calculated resultant force (F) exerted on the last E. coli chain as a function of the E. coli number (N). The inset shows the calculation model.
    Fig. 4. Optical forces and torques. (a) Optical torques and rotational potential energy as a function of azimuthal angle θ. The inset shows the calculation model. The E. coli is orientated with an angle θ to the axis of probe II. Point i indicates the arbitrary interaction point with a position vector ri from the central point of the E. coli. (b) Simulated energy density distributions for E. coli chains consisting of 1–4 cells. (c) Energy density distribution along the axis of probe II with cell numbers of 0, 1, 2, and 3. The points A, B, and C were the positions of the cell chain extremities. X=1.1 was the X coordinate of the point O. (d) Calculated resultant force (F) exerted on the last E. coli chain as a function of the E. coli number (N). The inset shows the calculation model.
    Simulations for the orientation process. (a) Energy density distribution for P1=25 mW and P2=20 mW at θ=0. (b) Energy density distribution along the axes of the probes projected onto the X coordinate. (c) Optical torques on the E. coli as a function of azimuthal angle θ. (d) Rotational potential energy U as a function of azimuthal θ.
    Fig. 5. Simulations for the orientation process. (a) Energy density distribution for P1=25mW and P2=20mW at θ=0. (b) Energy density distribution along the axes of the probes projected onto the X coordinate. (c) Optical torques on the E. coli as a function of azimuthal angle θ. (d) Rotational potential energy U as a function of azimuthal θ.
    Optical torque T and corresponding rotational potential energy U for E. coli as a function of the azimuthal angle θ with different D2 and input power. (a) Optical torque T with P1=25 mW and P2=35 mW. (b) Rotational potential energy U with P1=25 mW and P2=35 mW. (c) Optical torque T with P1=25 mW and P2=15 mW. (d) Rotational potential energy U with P1=25 mW and P2=15 mW.
    Fig. 6. Optical torque T and corresponding rotational potential energy U for E. coli as a function of the azimuthal angle θ with different D2 and input power. (a) Optical torque T with P1=25mW and P2=35mW. (b) Rotational potential energy U with P1=25mW and P2=35mW. (c) Optical torque T with P1=25mW and P2=15mW. (d) Rotational potential energy U with P1=25mW and P2=15mW.
    Jianbin Huang, Xiaoshuai Liu, Yao Zhang, Baojun Li. Optical trapping and orientation of Escherichia coli cells using two tapered fiber probes[J]. Photonics Research, 2015, 3(6): 308
    Download Citation