Abstract
We report on the optical trapping and orientation of Escherichia coli (E. coli) cells using two tapered fiber probes. With a laser beam at 980 nm wavelength launched into probe I, an E. coli chain consisting of three cells was formed at the tip of probe I. After launching a beam at 980 nm into probe II, the E. coli at the end of the chain was trapped and oriented via the optical torques yielded by two probes. The orientation of the E. coli was controlled by adjusting the laser power of probe II. Experimental results were interpreted by theoretical analysis and numerical simulations.1. INTRODUCTION
Manipulation of single cells is of great importance in biomedical research, microbiology, cell–cell interaction, and microbiology. Trapping and orientation of individual nonspherical bacteria can promote the study of the interaction between specific regions of biological objects, which provides an efficient method to observe and describe the behavior of single cells and, further, to study the dynamics of bacteria populations [1,2]. Thus, it is of great importance in understanding the mechanisms of cell function [3]. In addition, scanning the angle between the long cell axis and the optical axis of the optical tweezer may allow for reconstruction of the three-dimensional structures using standard computerized tomography methods [4]. Moreover, when the cell was illuminated in different orientations, by studding the scattering light of different orientation, more information on the morphology of the cell can be obtained which can be used to discriminate between different cell types or, more importantly, between different cell states [5]. One of the most widely investigated nonspherical bacteria is Escherichia coli (E. coli) cells due to their critical role in biological engineering and industrial microbiology [6,7]. Some challenges, however, exist in realizing stable trapping and controllable orientation of E. coli cells. First, the E. coli cells in liquids swim in two patterns, “runs” and “tumbles” [8,9], which are related to the rotation direction of the flagella [10]. Second, the E. coli cells are strongly affected by Brownian motion in liquids due to their nanometer size [11]. To solve these challenges, optical methods based on resonant optical antennas [11] and optical tweezers [4,12] have been proposed to trap and orientate E. coli cells. However, the operations were limited to a fixed substrate or a specific depth of cell solutions, and the bulk structure of the optical system and focusing objective make it difficult to move and focus. Moreover, the difficulty in penetrating thick samples by the focus generated by the objective make it difficult to apply the system to thick samples. Fortunately, optical fibers provide an alternative approach to manipulate E. coli cells [13–15]. Among them, the fiber probe is a miniaturized and highly flexible tool for particle manipulation because light beams can be simply focused by the tip of the probe without the use of complicated optical components such as high-numerical-aperture objective. However, with only one laser beam applied for the cell manipulation, the orientation will only be determined once the cells are trapped [12,13], and therefore the accessible rotational axes or feasible angles are restrained. In this work, we report on the optical trapping and orientation of E. coli cells using two tapered fiber probes. With the 980 nm laser beams injected into the probes, an E. coli cell chain was formed and trapped at the tip of one probe while the cell at the end of chain can be controllably orientated by adjusting the power injected into the fiber probes.
2. RESULTS
Figure 1 shows the experimental scheme. Two probes with different divergence angles were placed in an E. coli solution [Fig. 1(a)], with an angle of 150° between the probe axes. After launching a laser beam into probe I, an E. coli chain consisting of three cells was formed at the tip of probe I [Fig. 1(b)]. Another beam was then injected into probe II. Due to the superposition of the two beams, the energy density at the intersection point of two probes, i.e., point in Fig. 1(a), was higher than those around it, resulting in a much stronger gradient force than the scattering force. Therefore, an E. coli cell can be trapped by the gradient force at point and the orientation of the cell can be realized by adjusting the powers in the two probes. At , the E. coli at point will be orientated with its axis along probe II due to the restoring torque [Fig. 1(c)], while at , the cell will be orientated along probe I [Fig. 1(d)]. The experimental setup is schematically shown in Fig. 1(e). Two laser beams at 980 nm wavelength (with a very weak absorption by E. coli cells) were launched into the two probes. The probes were fabricated by drawing single-mode fibers (connector type, FC/PC; core diameter, 9 μm; cladding diameter, 125 μm) through a flame-heating technique. Fibers I and II were fixed by two tunable microstages I and II, respectively. The lengths of the tapered part and the fiber stick out of the holding stage were about 75 μm and 9 cm, respectively. To decrease the oscillations in our experiment due to the environmental fluctuations, each fiber probe was sheathed by a glass capillary (inner diameter, 0.9 mm; wall thickness, 0.1 mm; length, 12 cm). One side of the glass capillary was fixed on the stage while the other side was stuck out. The length of the probe outside the capillary was about 2 mm. The probes were immersed in the E. coli solution. An optical microscope with a CCD camera was used for real-time monitoring and image capturing.
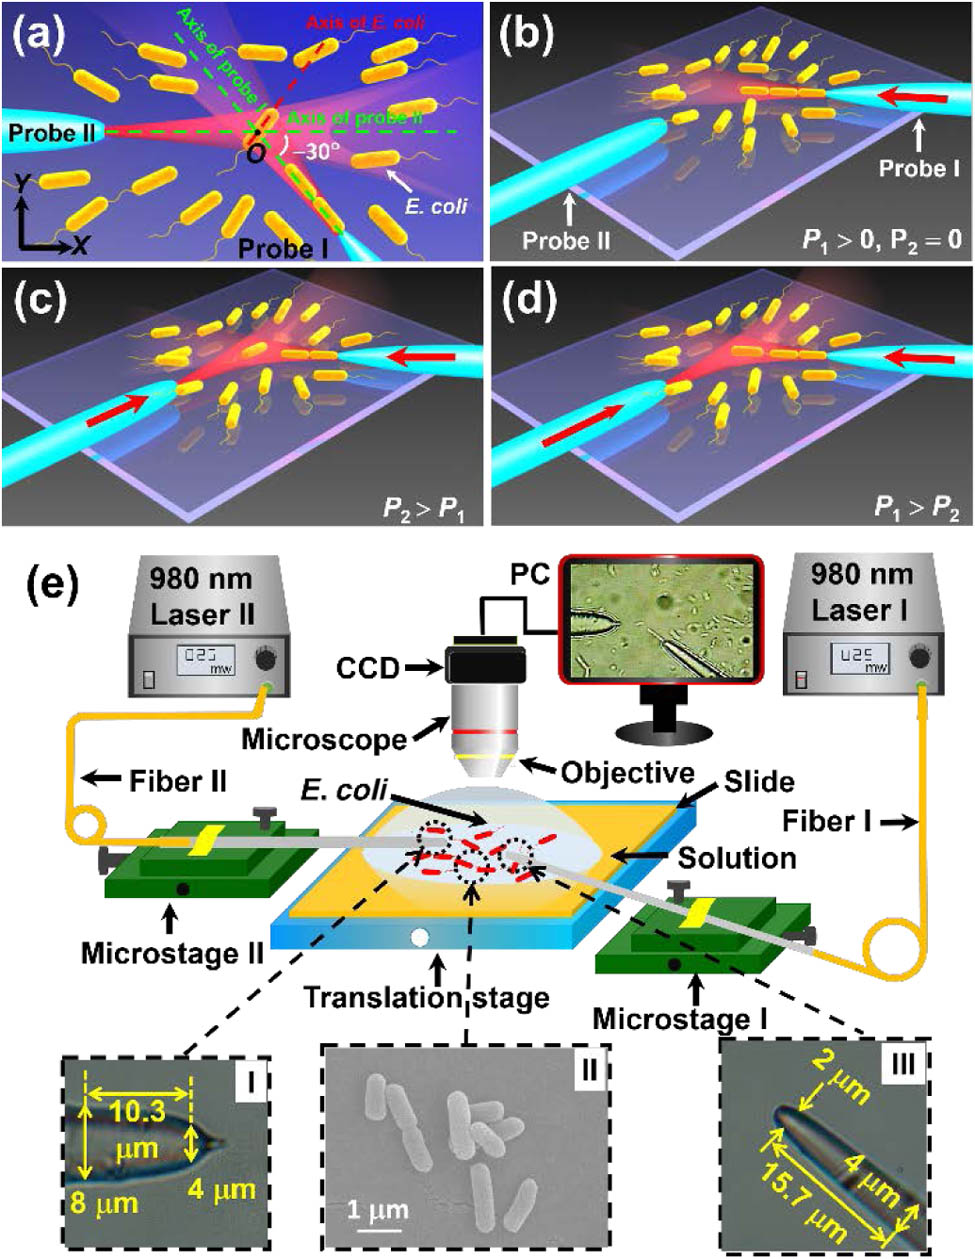
Figure 1.Schemes for the experimental model and setup. (a) Experimental model. The point is the intersection point of two fiber probes at which the E. coli cell will be trapped. (b) An E. coli cell chain was formed with a laser beam launched into probe I. (c) The E. coli cell is orientated along the axial of probe II when . (d) The cell is orientated along probe I when . (e) Experimental setup. Insets I and III indicate the optical microscope images of probe II and probe I, respectively. Inset II shows the scanning electron micrograph of the E. coli cells.
At the beginning of the experiment (), laser I was turned on to launch a beam of 25 mW into probe I while no laser was launched into probe II, i.e., and [Fig. 2(a)]. E. coli cells were trapped one after another by the optical forces generated by probe I and gradually formed into a cell chain. At , a chain consisting of three E. coli cells was formed [Fig. 2(b)]. At , laser II was also turned on to launch a beam of 20 mW into probe II, i.e., and . The E. coli at the end of the chain was pulled away from the chain by the optical force from probe II [Fig. 2(c)], and began to be rotated anticlockwise. At , the azimuthal angle of the E. coli, which is defined as the angle between the axes of the E. coli and probe II, was [Fig. 2(d)] and the orientation became stable. At , with increased from 20 to 35 mW, the cell was finally oriented along the axis of probe II, i.e., [Fig. 2(e)].
Sign up for Photonics Research TOC. Get the latest issue of Photonics Research delivered right to you!Sign up now

Figure 2.Optical microscope images for trapping and orientation of the E. coli. (a) At , turning on the 980 nm laser of 25 mW into probe I, the cells began to be trapped one after another. (b) At , a cell chain consisting of three E. coli cells was connected to the tip of probe I. (c) At , after a laser beam of 20 mW was injected into probe II, the last E. coli of the chain was pulled away from the chain. (d) At , the angle between the axis of the E. coli and probe II () was . (e) At , the input power of probe II was increased from 20 to 35 mW and the cell was orientated along probe II with of 0. (f) At , the input power of probe II was decreased from 35 to 15 mW and the cell began to rotate. (g) At , the cell was orientated along probe I with of .
At , with the power of probe II decreased from to 15 mW, the E. coli was rotated clockwise [Fig. 2(f)] and kept orientated along the axis of probe I [Fig. 2(g)], i.e., again.
3. ANALYSIS AND DISCUSSION
To interpret the phenomena just described, simulations were performed based on a finite element method (COMSOL Multiphysics 4.3b). In the simulations, the diameter of probe I was set as 4 μm at the input port and then linearly decreased to 2 μm within a length of 15.7 μm, with a parabolic extremity. The diameter of probe II was set as 8 μm at the input port and then linearly decreased to 4 μm within 10.3 μm. The axis of probe II was along the direction and the angle between the axes of the two probes was 150°. The E. coli cell was treated as a rod (diameter, 500 nm; length, 2 μm) with two hemispherical caps. The refractive indices are 1.33, 1.39, and 1.44 for the water, E. coli, and probes at the laser wavelength of 980 nm. Distributions of energy density for the two probes were obtained by the simulations (Fig. 3). When only laser I was launched into probe I, the energy was concentrated near the tip of probe I [Fig. 3(a)] with a focal plane at [Fig. 3(b)], which results in a strong gradient force exerted on the E. coli. When only laser II was launched into probe II, the energy was concentrated at a position further away from the tip of probe II [Fig. 3(c)], with a focal plane at [Fig. 3(d)]. The light output from probe I was focused nearly at the tip while the light from probe II was focused 3.6 μm away from the tip, which is attributed to the different profiles and sizes of the two probes. As a result, probe I was used to form and trap a cell chain of E. coli cells while probe II was used to manipulate the single cell at the end of the chain.
Figure 3.Simulated distributions of energy density for the two probes. (a) Energy density distribution of probe I. (b) Energy density along the axis of probe I. (c) Energy density distribution of probe II. (d) Energy density along the axis of probe I.
The optical force () exerted on the E. coli can be calculated by integrating the time-dependent Maxwell stress tensor around the E. coli with a closed surface [16,17]: where is the surface normal vector. The optical torque , which determines the orientation of the E. coli cell, can be calculated by [18] where is the optical force element at an arbitrary point within the E. coli cell that interacts with light, and is the position vector point from the center point of the E. coli cell where is generated. Figure 4(a) shows the calculated optical torque on the E. coli cell as a function of the azimuthal angle with respect to the direction. The inset of Fig. 4(a) describes the calculation model. For probe I, is 0 when , , and 60°. In the regions of and , the values of are positive and negative so that the E. coli is rotated anticlockwise and clockwise, respectively. For probe II, is 0 when , , and 90°. In the regions of and , the values of are positive and negative so that the E. coli is rotated anticlockwise and clockwise, respectively. Therefore, the E. coli trapped by probes I and II tends to be rotated toward and , respectively. The rotational potential energy of the two probes were evaluated by integrating with respect to . For stable trapping, must overcome the thermal energy [19], i.e., , where was the Boltzmann constant and was the absolute temperature of the solution. In this work, has to satisfy that . For probes I and II, reaches minimum at and , respectively, confirming that and are the most stable orientations for the E. coli trapped by probes I and II, respectively. E. coli cells will be trapped at the axis of either probe by the optical force and rotated by the optical torque until the axis of the E. coli coincides with the probe axis. With an input power of 25 mW, four E. coli cells can be trapped by the probe [13]. Figure 4(b) shows the simulated energy density distributions of E. coli cell chains consisting of 1–4 cells at an input power at 25 mw. Light was confined in the E. coli cells and propagated along the chain, indicating that the E. coli cells trapped by probe I can be seen as the extension of the fiber tip, resulting in more E. coli cells being trapped. Figure 4(c) shows the energy density distribution along the axis of probe I with cell numbers of , 1, 2, and 3. When the number of the E. coli chain is increased from 0 to 3, more energy will be concentrated along the axis of the probe. As a result, for probe I with a cell chain formed at the tip, the optical intensity at point is stronger than that without a chain. Figure 4(d) shows the calculated resultant optical force () exerted on the last E. coli of the chain, consisting of 1–4 cells. The optical forces exerted on the last E. coli were directed to the probe, which means that this force was the trapping force.
Figure 4.Optical forces and torques. (a) Optical torques and rotational potential energy as a function of azimuthal angle . The inset shows the calculation model. The E. coli is orientated with an angle to the axis of probe II. Point indicates the arbitrary interaction point with a position vector from the central point of the E. coli. (b) Simulated energy density distributions for E. coli chains consisting of 1–4 cells. (c) Energy density distribution along the axis of probe II with cell numbers of 0, 1, 2, and 3. The points A, B, and C were the positions of the cell chain extremities. was the coordinate of the point . (d) Calculated resultant force () exerted on the last E. coli chain as a function of the E. coli number (). The inset shows the calculation model.
To analyze the orientation process, simulations were then performed by increasing the input power of probe II to 20 mW while keeping the input power of probe I at 25 mW. In the simulation, two E. coli cells were connected with probe I. Figure 5(a) shows the simulated distributions of energy density emitted from the two probes. The distances between the probe tip and the intersection point of probes (, ) were and for probes I and II, respectively. At the intersection point, energy density was higher than those around it because of the superposition of two laser beams. The E. coli near the intersection point will be trapped by the gradient force. Figure 5(b) shows the energy density distributions along the axes of the probes projected onto the coordinate. The strongest optical intensity was at rather than the focus point of probe II (), indicating that the trapping area of the E. coli can be adjusted by changing the positions of the probes. Figure 5(c) shows the calculated optical torques as a function of input power. For and , the torque is 0 when . The torque becomes positive and negative when and , respectively, indicating that the orientation is stable at . Similarly, for and and for and , the orientation is stable at and , respectively. The rotational potential energy of two probes reached the corresponding minimum at , , and [Fig. 5(d)], which also indicates the angles for the stable orientations. Note that the experimental results presented in Figs. 2(d) and 2(g) are a bit different from those obtained by calculations. This is because in our models for calculations, the E. coli was simplified as a rod with two hemispherical caps, while actually the E. coli was not always so symmetrical and straight, as shown by the scanning electron micrograph image in the inset II of Fig. 1(e). The slight difference in shape and size also exists in the fiber probe models and the fabricated ones.
Figure 5.Simulations for the orientation process. (a) Energy density distribution for and at . (b) Energy density distribution along the axes of the probes projected onto the coordinate. (c) Optical torques on the E. coli as a function of azimuthal angle . (d) Rotational potential energy as a function of azimuthal .
To further analyze the optical torques on the E. coli with different distance between the probe and E. coli, a series of simulations were performed by changing the position of probe II while fixing probe I at . Figure 6, as an example, shows calculated optical torque and corresponding rotational potential as a function of the azimuthal angle . At input power , , the variation of the values of for , 2.9, and 3.9 μm is very small compared with those for [Fig. 6(a)], which indicates that the cell can be rotated toward . The corresponding rotational potential reaches a minimum of less than around [Fig. 6(b)]. The E. coli will be orientated along the axis of probe II so that the orientation of the cell can be controlled, with ranging from 2.4 to 3.9 μm. Similarly, at input power , , the variation of values of for and 3.9 μm is also very small compared with those for [Fig. 6(c)]. The corresponding minima of were and [Fig. 6(d)], which indicates that the E. coli can also be orientated by probe I. For , the minimum of was , which was more than . Thus, in this situation, the cell orientation cannot be realized by probe I. This is because the focus of probe II was 1.2 μm away from the intersection point of the axes of the probes in this case. The input power of probe I was decreased and thereby the energy density at the point where the E. coli was trapped was not strong enough to control the orientation of the E. coli.
Figure 6.Optical torque and corresponding rotational potential energy for E. coli as a function of the azimuthal angle with different and input power. (a) Optical torque with and . (b) Rotational potential energy with and . (c) Optical torque with and . (d) Rotational potential energy with and .
4. CONCLUSIONS
An optical method for trapping and orientation of E. coli cells has been experimentally demonstrated using two probes. By launching a laser beam at 980 nm into probe I, an E. coli chain was formed at the probe tip, followed by a trapping and orientation of the E. coli at the end of the chain by launching another beam into probe II. The orientation of the E. coli was then controlled by adjusting the laser power of probe II. The performance of the method in terms of resultant optical torque and the corresponding rotational potential energy has been numerically analyzed with simulations and calculations. These results are expected to find application in single-cell studies in which optical manipulation of nonspherical bacteria is desired.
Acknowledgment
Acknowledgment. This work was supported by the Program for Changjiang Scholars and Innovative Research Team in University (IRT13042) and the National Natural Science Foundation of China (No. 61205165).
References
[1] A. Elfwing, Y. LeMarc, J. Baranyi, A. Ballagi. Observing growth and division of large numbers of individual bacteria by image analysis. Appl. Environ. Microbiol., 70, 675-678(2004).
[2] D. R. Tyson, S. P. Garbett, P. L. Frick, V. Quaranta. Fractional proliferation: a method to deconvolve cell population dynamics from single-cell data. Nat. Methods, 9, 923-928(2012).
[3] T. J. Gould, M. S. Gunewardene, M. V. Gudheti, V. V. Verkhusha, S. R. Yin, J. A. Gosse, S. T. Hess. Nanoscale imaging of molecular positions and anisotropies. Nat. Methods, 5, 1027-1030(2008).
[4] G. Carmon, M. Feingold. Rotation of single bacterial cells relative to the optical axis using optical tweezers. Opt. Lett., 36, 40-42(2011).
[5] D. Watson, N. Hagen, J. Diver, P. Marchand, M. Chachisvilis. Elastic light scattering from single cells: orientational dynamics in optical trap. Biophys. J., 87, 1298-1306(2004).
[6] C. Schlieker, B. Bukau, A. Mogk. Prevention and reversion of protein aggregation by molecular chaperones in the E. coli cytosol: implications for their applicability in biotechnology. J. Biotechnol., 96, 13-21(2002).
[7] E. Russo. Special report: the birth of biotechnology. Nature, 421, 456-457(2003).
[8] H. C. Berg. The rotary motor of bacterial flagella. Biochemistry, 72, 19-54(2003).
[9] J. Tailleur, M. E. Cates. Statistical mechanics of interacting run-and–tumble bacteria. Phys. Rev. Lett., 100, 218103(2008).
[10] S. H. Larsen, R. W. Reader, E. N. Kort, W. W. Tso, J. Adler. Change in direction of flagellar rotation is the basis of the chemotactic response in Escherichia coli. Nature, 249, 74-77(1974).
[11] M. Righini, P. Ghenuche, S. Cherukulappurath, V. Myroshnychenko, F. J. García de Abajo, R. Quidant. Nano-optical trapping of Rayleigh particles and Escherichia coli bacteria with resonant optical antennas. Nano Lett., 9, 3387-3391(2009).
[12] H. Zhang, K. K. Liu. Optical tweezers for single cells. J. R. Soc. Interface, 5, 671-690(2008).
[13] H. Xin, Y. Zhang, H. Lei, Y. Li, H. Zhang, B. Li. Optofluidic realization and retaining of cell-cell contact using an abrupt tapered optical fiber. Sci. Rep., 3, 1993(2013).
[14] H. Xin, Y. Li, X. Liu, B. Li. Escherichia coli–based biophotonic waveguides. Nano Lett., 13, 3408-3413(2013).
[15] A. L. Barron, A. K. Kar, T. J. Aspray, A. J. Waddie, M. R. Taghizadeh, H. T. Bookey. Two-dimensional interferometric optical trapping of multiple particles and Escherichia coli bacterial cells using a lensed multicore fiber. Opt. Express, 21, 13199-13207(2013).
[16] B. S. Schmidt, A. H. J. Yang, D. Erickson, M. Lipson. Optofluidic trapping and transport on solid core waveguides within a microfluidic device. Opt. Express, 15, 14322-14334(2007).
[17] A. H. J. Yang, D. Erickson. Stability analysis of optofluidic transport on solid-core waveguiding structures. Nanotechnology, 19, 045704(2008).
[18] R. C. Gauthier. Theoretical investigation of the optical trapping force and torque on cylindrical micro-objects. J. Opt. Soc. Am. B, 14, 3323-3333(1997).
[19] T. Shaoji, Y. Tsuboi. Plasmonic optical tweezers toward molecular manipulation: tailoring plasmonic nanostructure, light source, and resonant trapping. J. Phys. Chem. Lett., 5, 2957-2967(2014).

