• Advanced Photonics
  • Vol. 4, Issue 2, 026004 (2022)
Ying Zuo1、†, Chenfeng Cao1, Ningping Cao2、3, Xuanying Lai4, Bei Zeng1、*, and Shengwang Du4、*
Author Affiliations
  • 1The Hong Kong University of Science and Technology, Department of Physics, Hong Kong, China
  • 2University of Guelph, Department of Mathematics and Statistics, Guelph, Ontario, Canada
  • 3University of Waterloo, Institute for Quantum Computing, Waterloo, Ontario, Canada
  • 4The University of Texas at Dallas, Department of Physics, Richardson, Texas, United States
  • show less
    DOI: 10.1117/1.AP.4.2.026004 Cite this Article Set citation alerts
    Ying Zuo, Chenfeng Cao, Ningping Cao, Xuanying Lai, Bei Zeng, Shengwang Du. Optical neural network quantum state tomography[J]. Advanced Photonics, 2022, 4(2): 026004 Copy Citation Text show less
    Schematic of ONN-based QST.
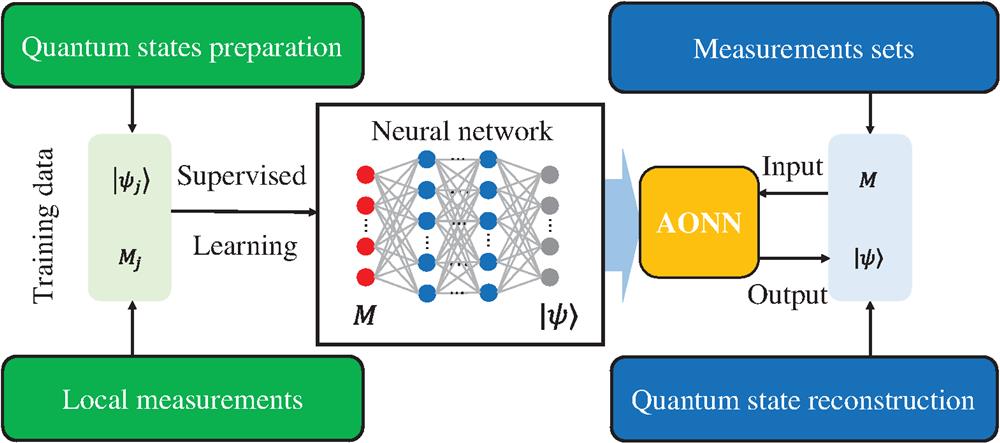
    Fig. 1. Schematic of ONN-based QST.
    The fidelities of NN predictions for different samples of Pauli operators: the red triangles are the average fidelities for UDA Pauli operator sets, which are very close to 1. A Pauli operator set is said to be “UDA” if measuring these operators can uniquely determine a pure state among all states. The green bars are the average fidelities for random sampled Pauli operator sets. The blue lines are the error bars for different samples. We train NN to predict state wavefunctions from measurements for (a) 1 qubit, (b) 2 qubits, and (c) 3 qubits.
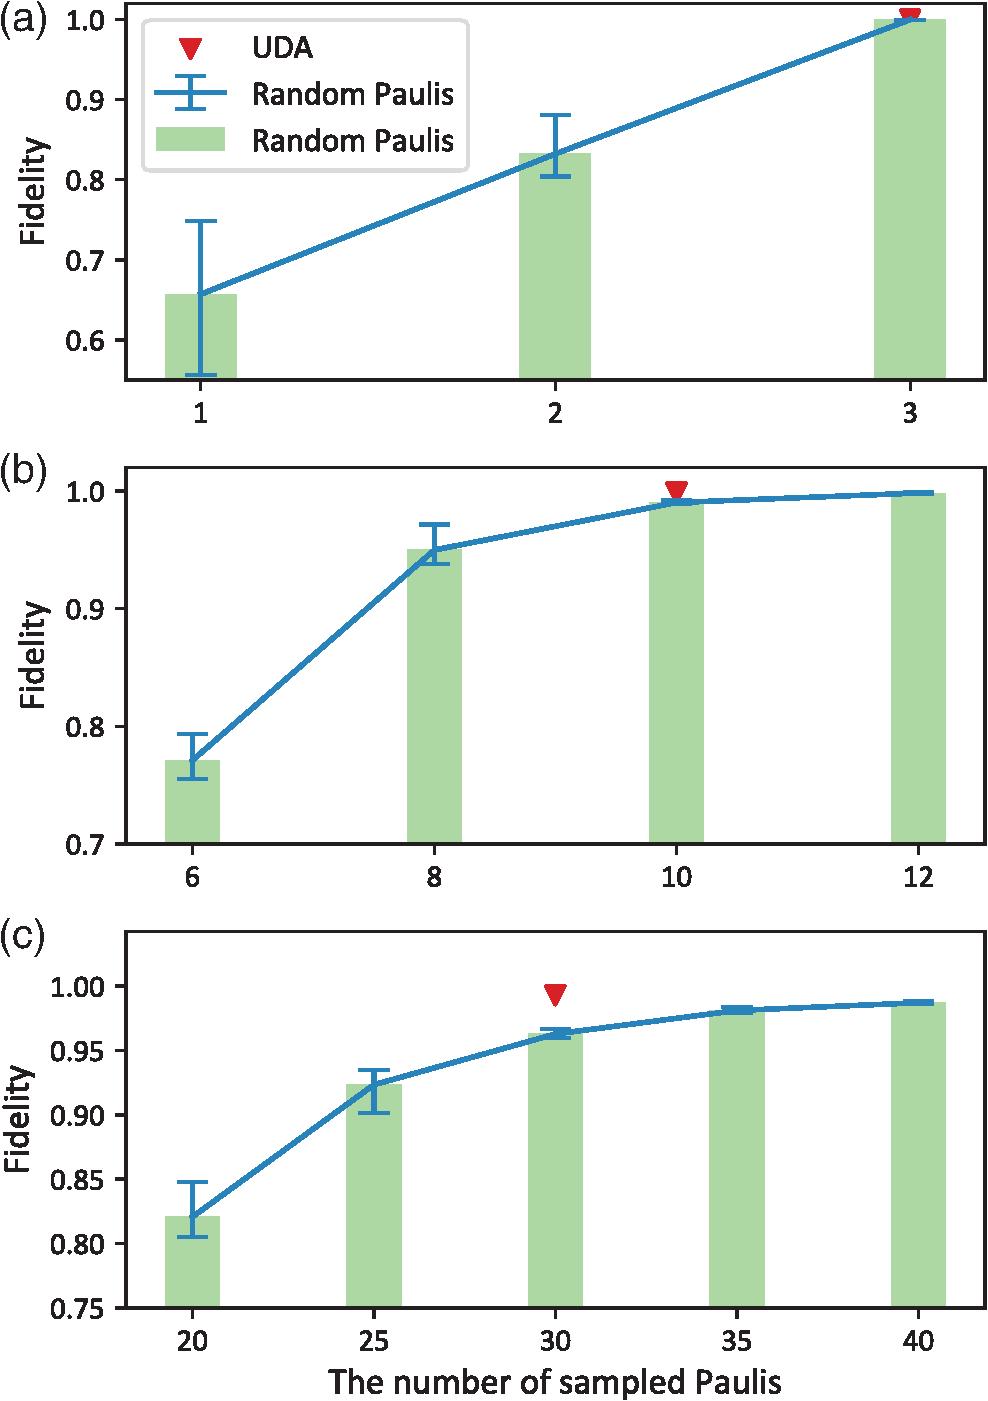
    Fig. 2. The fidelities of NN predictions for different samples of Pauli operators: the red triangles are the average fidelities for UDA Pauli operator sets, which are very close to 1. A Pauli operator set is said to be “UDA” if measuring these operators can uniquely determine a pure state among all states. The green bars are the average fidelities for random sampled Pauli operator sets. The blue lines are the error bars for different samples. We train NN to predict state wavefunctions from measurements for (a) 1 qubit, (b) 2 qubits, and (c) 3 qubits.
    Schematics of optical implementation of QST. (a) Optical layout of qubit QST, including generation of polarization state (top panel), measurement of ⟨Z⟩, ⟨X⟩, and ⟨Y⟩ (bottom panel). The fast axis of the HWP1 is aligned with an angle π/4−θ/2 to the horizontal direction. The fast axis of the QWP1 is aligned with an angle π/4 to the horizontal direction. (b) Schematic of ONN. (I) Input generation, (II) linear operation of the first layer, (III) nonlinear operation, and (IV) linear operation of the second layer. Spatial light modulators: SLM1 (HOLOEYE LETO), SLM2 (HOLOEYE PLUTO-2), and SLM3 (HOLOEYE GEAE-2). Camera: Hamamatsu C11440-22CU. Lenses: L1–L9. Atoms are trapped in a MOT. (c) The NN structure employed.
    Fig. 3. Schematics of optical implementation of QST. (a) Optical layout of qubit QST, including generation of polarization state (top panel), measurement of Z, X, and Y (bottom panel). The fast axis of the HWP1 is aligned with an angle π/4θ/2 to the horizontal direction. The fast axis of the QWP1 is aligned with an angle π/4 to the horizontal direction. (b) Schematic of ONN. (I) Input generation, (II) linear operation of the first layer, (III) nonlinear operation, and (IV) linear operation of the second layer. Spatial light modulators: SLM1 (HOLOEYE LETO), SLM2 (HOLOEYE PLUTO-2), and SLM3 (HOLOEYE GEAE-2). Camera: Hamamatsu C11440-22CU. Lenses: L1L9. Atoms are trapped in a MOT. (c) The NN structure employed.
    (a) Optical tomography of the qubit and (b) experimental ONN tomography result. The ONN is training by (b1) optical tomography data and (b2) IBMQ tomography data. The black dashed line is the theoretical value of the phase θ according to the ⟨X⟩. The blue circles are the phase θ numerically predicted by the trained NN, and the red triangles are the experimentally measured predictions of θ according to ⟨X⟩. The yellow triangle is an example of the experimental ONN predicted state.
    Fig. 4. (a) Optical tomography of the qubit and (b) experimental ONN tomography result. The ONN is training by (b1) optical tomography data and (b2) IBMQ tomography data. The black dashed line is the theoretical value of the phase θ according to the X. The blue circles are the phase θ numerically predicted by the trained NN, and the red triangles are the experimentally measured predictions of θ according to X. The yellow triangle is an example of the experimental ONN predicted state.
    Ying Zuo, Chenfeng Cao, Ningping Cao, Xuanying Lai, Bei Zeng, Shengwang Du. Optical neural network quantum state tomography[J]. Advanced Photonics, 2022, 4(2): 026004
    Download Citation