• Chinese Optics Letters
  • Vol. 21, Issue 4, 041204 (2023)
Yu Zhao1、2、*, Jiawei Li1、2, Menglei Zhang1、2, Yangyang Zhao1、2, Jianglin Zou1、2, and Tao Chen1、2、**
Author Affiliations
  • 1Institute of Advanced Photonic Technology, Faculty of Materials and Manufacturing, Beijing University of Technology, Beijing 100124, China
  • 2Key Laboratory of Trans-scale Laser Manufacturing Technology (Beijing University of Technology), Ministry of Education, Beijing 100124, China
  • show less
    DOI: 10.3788/COL202321.041204 Cite this Article Set citation alerts
    Yu Zhao, Jiawei Li, Menglei Zhang, Yangyang Zhao, Jianglin Zou, Tao Chen. Phase-unwrapping algorithm combined with wavelet transform and Hilbert transform in self-mixing interference for individual microscale particle detection[J]. Chinese Optics Letters, 2023, 21(4): 041204 Copy Citation Text show less
    Simulated signal from a 5 µm diameter particle. (a) Temporal signal; (b) phase profile.
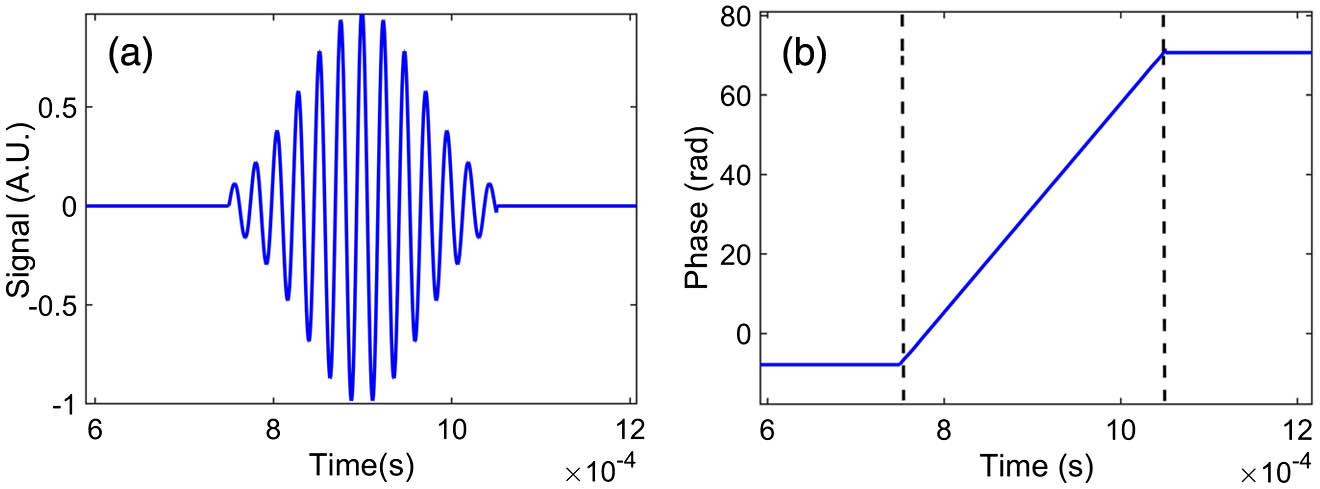
    Fig. 1. Simulated signal from a 5 µm diameter particle. (a) Temporal signal; (b) phase profile.
    Chart diagram of CWT-HT signal processing algorithm for particle-induced SMI signal.
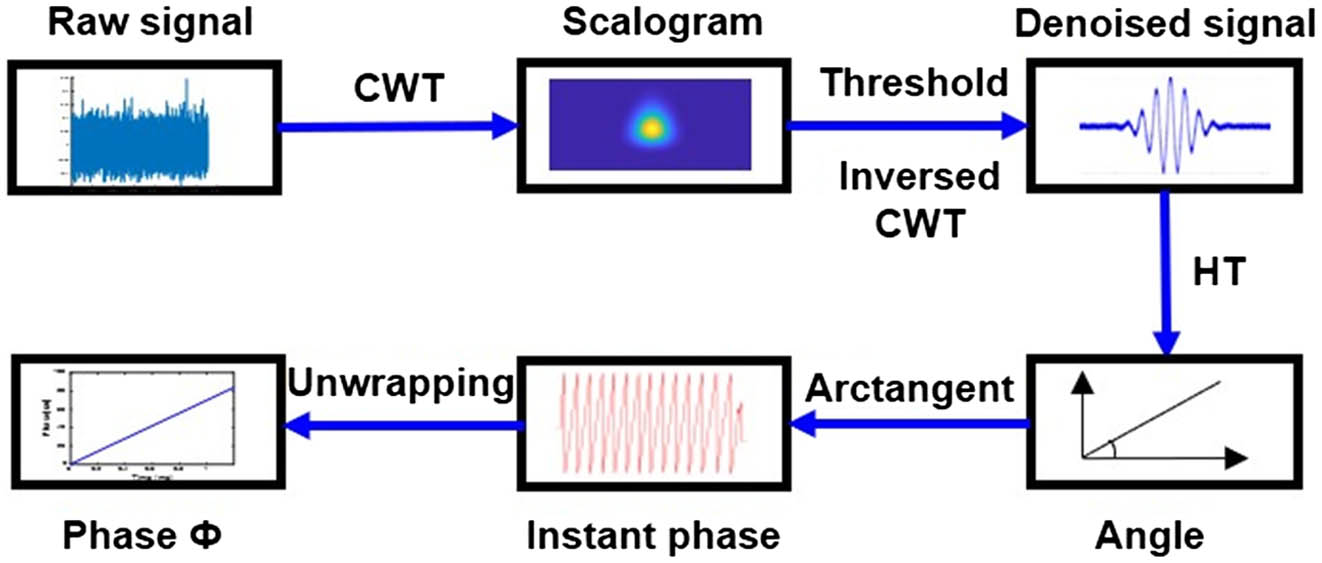
    Fig. 2. Chart diagram of CWT-HT signal processing algorithm for particle-induced SMI signal.
    Schematic of SMI system.
    Fig. 3. Schematic of SMI system.
    Signal burst of 2 µm PS particle. (a) Raw SMI signal (black), denoised SMI signals by BPF (red) and CWT (blue); (b) scalogram of CWT.
    Fig. 4. Signal burst of 2 µm PS particle. (a) Raw SMI signal (black), denoised SMI signals by BPF (red) and CWT (blue); (b) scalogram of CWT.
    Phase profiles of the 2 µm PS particle SMI signal by BPF (red) and CWT (blue).
    Fig. 5. Phase profiles of the 2 µm PS particle SMI signal by BPF (red) and CWT (blue).
    Signal bursts of the PS particles in different diameters after CWT denoising. (a) 500 nm; (b) 3 µm; (c) 4 µm; (d) 5 µm.
    Fig. 6. Signal bursts of the PS particles in different diameters after CWT denoising. (a) 500 nm; (b) 3 µm; (c) 4 µm; (d) 5 µm.
    Phase curve as a function of the particle diameter. The blue circle marks represent the mean values and the standard deviations of the measured value of phase Φ. The black line and red solid line denote the simulation results and the linear fitting.
    Fig. 7. Phase curve as a function of the particle diameter. The blue circle marks represent the mean values and the standard deviations of the measured value of phase Φ. The black line and red solid line denote the simulation results and the linear fitting.
    ParameterλθincDK
    Value532 nm25°5 µm1 µm
    Table 1. Parameters for Simulation
    Yu Zhao, Jiawei Li, Menglei Zhang, Yangyang Zhao, Jianglin Zou, Tao Chen. Phase-unwrapping algorithm combined with wavelet transform and Hilbert transform in self-mixing interference for individual microscale particle detection[J]. Chinese Optics Letters, 2023, 21(4): 041204
    Download Citation