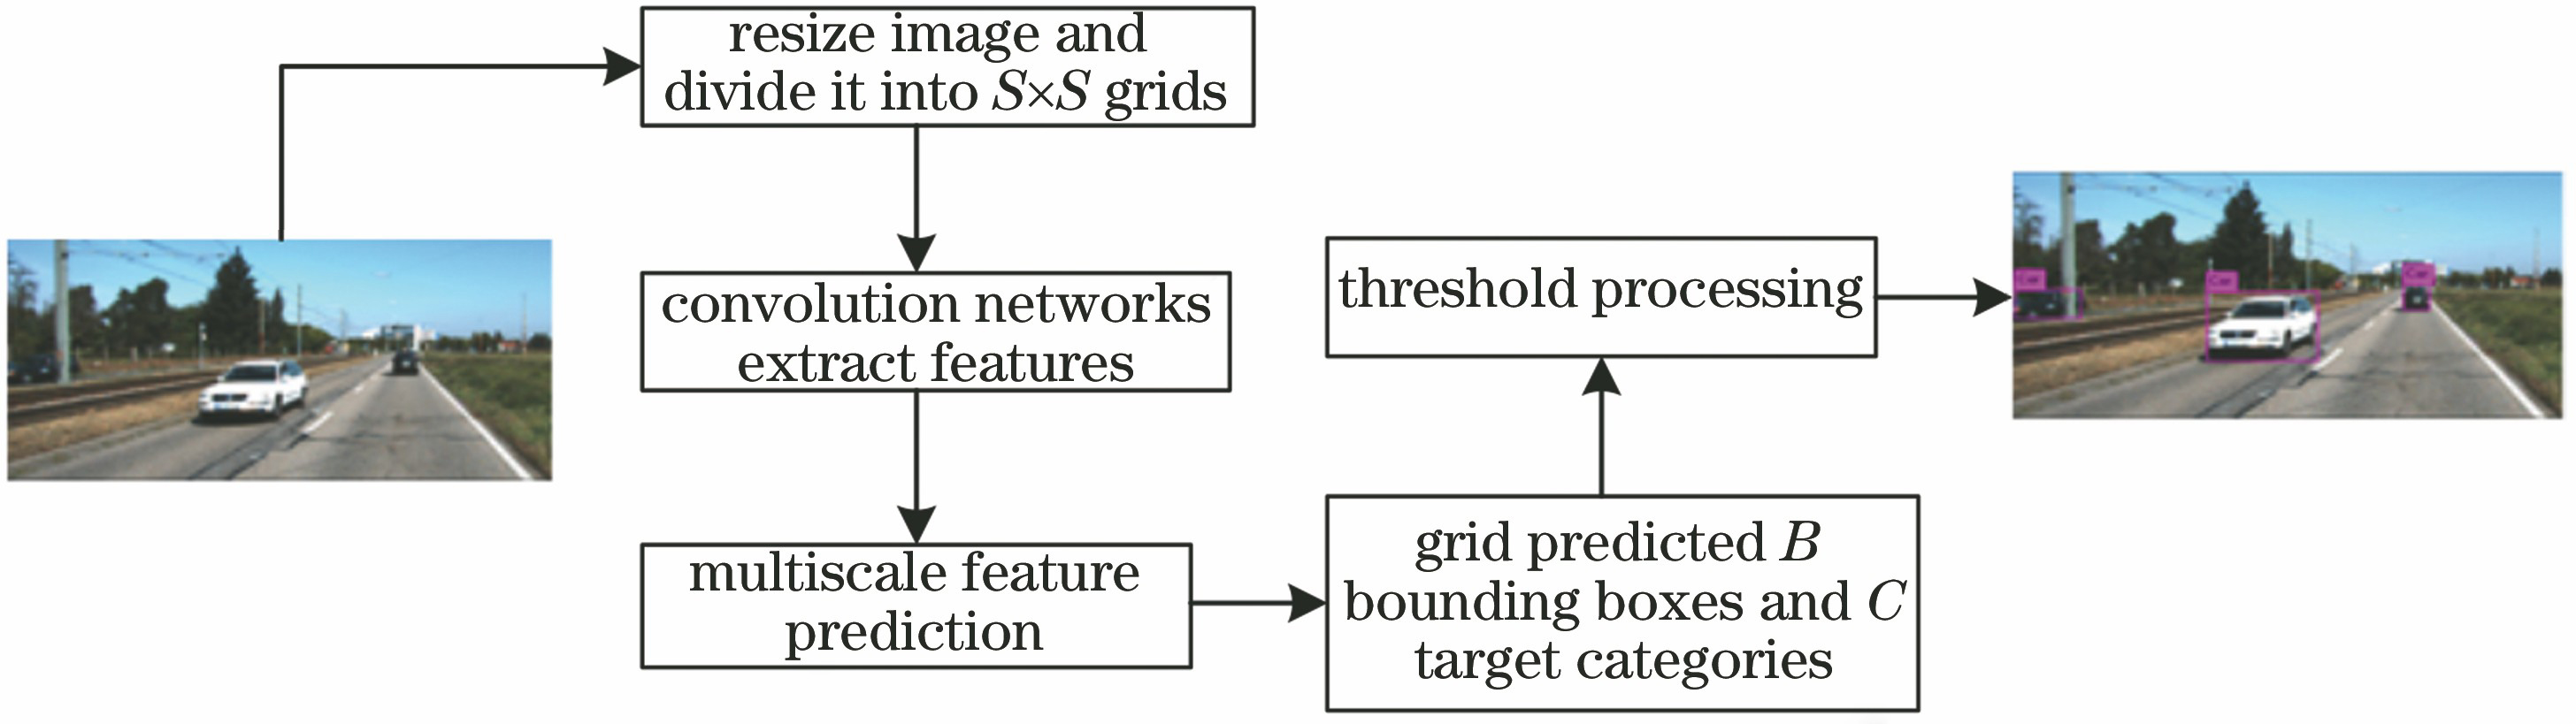
Fig. 1. Flowchart of RF-YOLOv2 detection
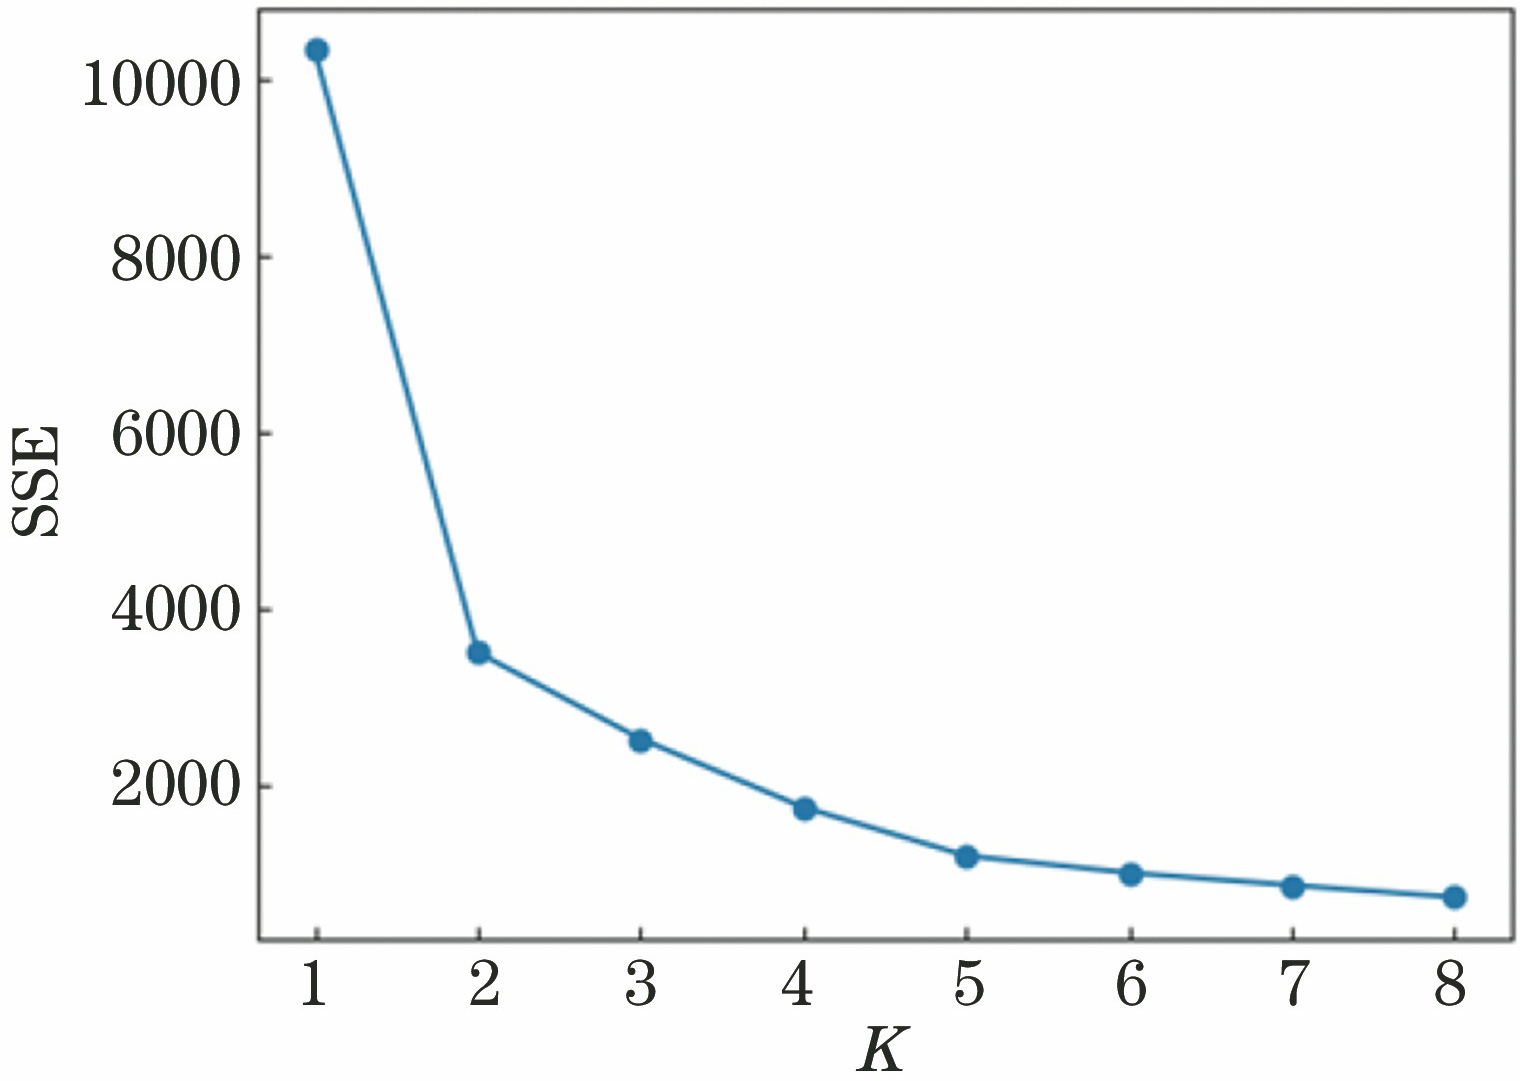
Fig. 2. Object function change curve
Fig. 3. Residual block structure
Fig. 4. Feature pyramid network
Fig. 5. Flowchart of RF-YOLOv2
Fig. 6. Number of categories appearing on KITTI data set
Fig. 7. Loss graph for two models
Fig. 8. Precision-Recall curves of two models. (a)(c)(e) YOLOv2 model;(b)(d)(f) RF-YOLOv2 model
Fig. 9. Detection results. (a)(c)(e)(g)(i) Detection results of YOLOv2 model; (b)(d)(f)(h)(j) detection results of RF-YOLOv2 model
Layerblock | Type | Numberof filters | Size /stride | Output |
---|
| Convolutional | 32 | 3×3 | 416×416 | | Maxpool | | 2×2/2 | 208×208 | | Convolutional | 64 | 3×3 | 208×208 | 1× | Convolutional | 32 | 1×1 | | | Convolutional | 64 | 3×3 | | | Residual | | | 208×208 | | Maxpool | | 2×2/2 | 104×104 | | Convolutional | 128 | 3×3 | 104×104 | 2× | Convolutional | 64 | 1×1 | | | Convolutional | 128 | 3×3 | | | Residual | | | 104×104 | | Maxpool | | 2×2/2 | 52×52 | | Convolutional | 256 | 3×3 | 52×52 | 4× | Convolutional | 128 | 1×1 | | | Convolutional | 256 | 3×3 | | | Residual | | | 52×52 | | Maxpool | | 2×2/2 | 26×26 | | Convolutional | 512 | 3×3 | 26×26 | 4× | Convolutional | 256 | 1×1 | | | Convolutional | 512 | 3×3 | | | Residual | | | 26×26 | | Maxpool | | 2×2/2 | 13×13 | | Convolutional | 1024 | 3×3 | 13×13 | 4× | Convolutional | 512 | 1×1 | | | Convolutional | 1024 | 3×3 | | | Residual | | | 13×13 | | Avgpool | | Global | 3 | | Softmax | | | |
|
Table 1. RF-YOLOv2 network structure
Model | Accuracyofcar /% | Accuracy ofpedestrian /% | Accuracy ofcyclist /% | Detectionspeed /(frame·s-1) |
---|
YOLOv2 | 68.56 | 44.26 | 55.95 | 46.4 | RF-YOLOv2 | 87.88 | 52.91 | 74.05 | 30.3 | YOLOv3 | 89.34 | 60.93 | 83.94 | 23.1 |
|
Table 2. Comparison of accuracy and detection speed
Number oftraining | RF-YOLOv2 model | YOLOv2 model |
---|
Recallrate /% | IOU /% | Recallrate /% | IOU /% |
---|
10000 | 50.36 | 43.29 | 48.18 | 43.42 | 20000 | 55.45 | 46.34 | 53.11 | 45.98 | 30000 | 61.47 | 50.65 | 55.83 | 47.79 | 40000 | 64.92 | 52.56 | 54.13 | 46.72 | 50000 | 65.87 | 53.63 | 57.98 | 49.04 |
|
Table 3. Change process of recall rate and IOU
Model | Accuracy of easy sample /% | Accuracy of moderate sample /% | Accuracy of hard sample /% |
---|
YOLOv2 | 70.56 | 57.32 | 50.44 | Faster-rcnn | 87.90 | 79.11 | 70.19 | RF-YOLOv2 | 91.01 | 81.26 | 72.41 |
|
Table 4. Three sample detection results of car category
Model | Accuracy of easy sample /% | Accuracy of moderate sample /% | Accuracy of hard sample /% |
---|
YOLOv2 | 59.97 | 49.05 | 44.91 | Faster-rcnn | 78.35 | 65.91 | 61.19 | RF-YOLOv2 | 64.35 | 57.02 | 53.94 |
|
Table 5. Three sample detection results of pedestrian category
Model | Accuracy of easy sample /% | Accuracy of moderate sample /% | Accuracy of hard sample /% |
---|
YOLOv2 | 56.47 | 56.68 | 53.02 | Faster-rcnn | 71.41 | 62.81 | 55.44 | RF-YOLOv2 | 79.76 | 74.68 | 72.41 |
|
Table 6. Three sample detection results of cyclist category