• Infrared and Laser Engineering
  • Vol. 51, Issue 6, 20210641 (2022)
Zhihao Xu1, Zhaofa Zhou1, Zihao Xu2, Zhenjun Chang1, and Lei Feng1
Author Affiliations
  • 1Missile Engineering Institute, Rocket Force University of Engineering, Xi'an 710025, China
  • 2Air Force Academy, Beijing 100085, China
  • show less
    DOI: 10.3788/IRLA20210641 Cite this Article
    Zhihao Xu, Zhaofa Zhou, Zihao Xu, Zhenjun Chang, Lei Feng. SINS/CNS fast calibration method based on global observability analysis[J]. Infrared and Laser Engineering, 2022, 51(6): 20210641 Copy Citation Text show less
    (a) Pitch angle error curve; (b) Roll angle error curve; (c) Heading angle error curve
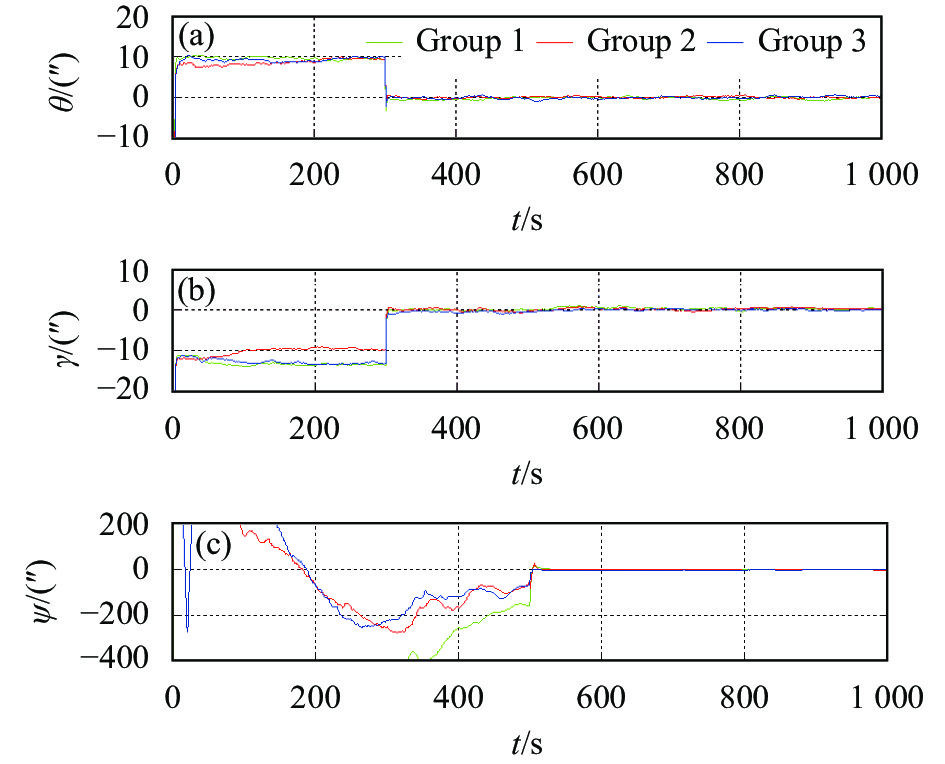
    Fig. 1. (a) Pitch angle error curve; (b) Roll angle error curve; (c) Heading angle error curve
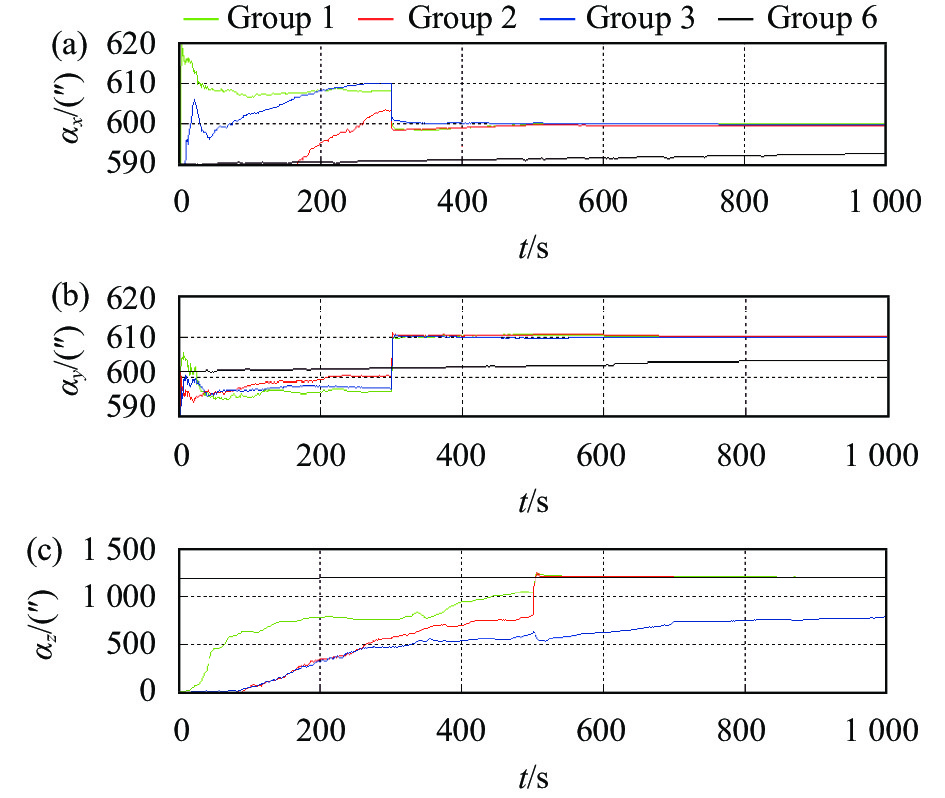
    (a) x-axis installation error estimation curve; (b) y-axis installation error estimation curve; (c) z-axis installation error estimation curve
    Fig. 2. (a) x-axis installation error estimation curve; (b) y-axis installation error estimation curve; (c) z-axis installation error estimation curve
    (a) x-axis gyro constant drift estimation curve; (b) y-axis gyro constant drift estimation curve; (c) z-axis gyro constant drift estimation curve
    Fig. 3. (a) x-axis gyro constant drift estimation curve; (b) y-axis gyro constant drift estimation curve; (c) z-axis gyro constant drift estimation curve
    (a) x-axis accelerometer zero deviation estimation curve; (b) y-axis accelerometer zero deviation estimation curve; (c) z-axis accelerometer zero deviation estimation curve
    Fig. 4. (a) x-axis accelerometer zero deviation estimation curve; (b) y-axis accelerometer zero deviation estimation curve; (c) z-axis accelerometer zero deviation estimation curve
    Observability curve of attitude error
    Fig. 5. Observability curve of attitude error
    Observability curve of installation error
    Fig. 6. Observability curve of installation error
    Observability curve of constant drift of gyro
    Fig. 7. Observability curve of constant drift of gyro
    Observability curve of accelerometer zero deviation
    Fig. 8. Observability curve of accelerometer zero deviation
    Error statesGroup 1Group 4Group 5
    Initial misalignment angles/(°)(0.01 0.01 0.05)
    Gyro bias/(°)·h−10.010.0030.01
    Angular random walk coefficient/(°)·h−10.0050.00050.005
    Accelerometer bias / ${\text{μg} }$505050
    Speed random walk coefficient $/{\text{μg} } \cdot \sqrt {\text{s} }$101010
    Star sensor accuracy/(″)(3σ) 3315
    Installation error/(′)(10 10 20 )
    Table 1. Error parameter settings
    GroupFeature amount$ {\alpha _x}/('') $$ {\alpha _y}/('') $$ {\alpha _z}/('') $$ {\varepsilon _x} $/(°)·h−1${\varepsilon _y}$/(°)·h−1${\varepsilon _z}$/(°)·h−1${\nabla _x}{\text{/μg} }$${\nabla _y}{\text{/μg} }$${\nabla _z}{\text{/μg} }$
    1Mean−0.270.23−0.28−0.0001−0.00030.00020.250.220.11
    Standard deviation0.450.300.510.00140.00140.00180.280.830.21
    2Mean0.350.390.37−0.00060.0005−0.00060.26−0.230.16
    Standard deviation0.630.730.750.00150.00170.00210.280.880.25
    3Mean0.320.49−193.5−0.0010−0.0009−0.00130.30−0.140.25
    Standard deviation0.530.91216.50.00240.00160.00380.290.680.47
    4Mean0.170.21−0.31−0.0005−0.0002−0.00040.15−0.16−0.12
    Standard deviation0.430.320.490.00170.00240.00160.340.560.23
    5Mean0.580.65−0.52−0.00020.0004−0.00050.170.180.17
    Standard deviation0.721.211.130.00120.00090.00250.330.500.20
    6Mean6.366.611.75
    Standard deviation8.867.652.84
    Table 2. Statistical characteristic quantities of state quantity estimation residuals
    Zhihao Xu, Zhaofa Zhou, Zihao Xu, Zhenjun Chang, Lei Feng. SINS/CNS fast calibration method based on global observability analysis[J]. Infrared and Laser Engineering, 2022, 51(6): 20210641
    Download Citation