• Spectroscopy and Spectral Analysis
  • Vol. 41, Issue 9, 2846 (2021)
Yan LI1、1; 2;, Dan WEI1、1; 2; *;, Wei WANG3、3;, Liang JIN2、2;, Jian-li DING2、2;, Shan-shan CAI4、4;, Yu HU1、1;, and Yang BAI1、1;
Author Affiliations
  • 11. College of Resources and Environment, Northeast Agricultural University, Harbin 150030, China
  • 22. Institute of Plant Nutrition and Resources, Beijing Academy of Agriculture and Forestry Sciences, Beijing 100097, China
  • 33. Institute of Soil, Fertilizer and Environmental Resources, Heilongjiang Academy of Agricultural Sciences, Harbin 150086, China
  • 44. College of Land and Environment, Shenyang Agricultural University, Shenyang 110866, China
  • show less
    DOI: 10.3964/j.issn.1000-0593(2021)09-2846-07 Cite this Article
    Yan LI, Dan WEI, Wei WANG, Liang JIN, Jian-li DING, Shan-shan CAI, Yu HU, Yang BAI. Fluorescence Spectroscopy Characteristics of Dissolved Organic Matter Analysis of Straw-Cow Dung Fermentation in Different Proportion[J]. Spectroscopy and Spectral Analysis, 2021, 41(9): 2846 Copy Citation Text show less
    Three dimensional fluorescence components of DOM in different treatmentsPeak A: fulvic acid in UV region; Peak C: fulvic acid in visible region; Peak T: short wave tryptophan (proteinoid);Peak T1: long wave tryptophan; Peak F: humicacid; Peak B: tyrosine (proteinoid)
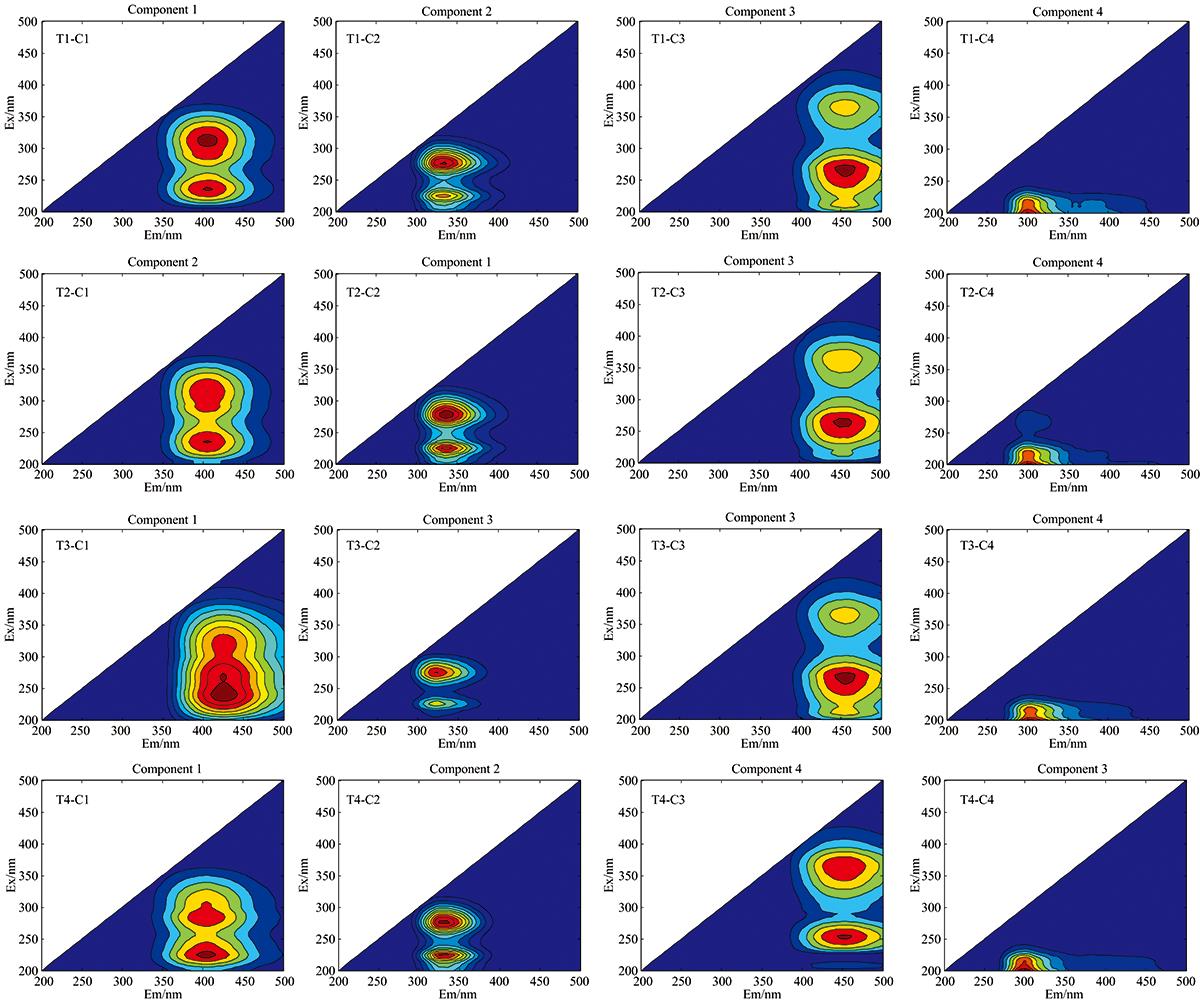
    Fig. 1. Three dimensional fluorescence components of DOM in different treatments
    Peak A: fulvic acid in UV region; Peak C: fulvic acid in visible region; Peak T: short wave tryptophan (proteinoid);Peak T1: long wave tryptophan; Peak F: humicacid; Peak B: tyrosine (proteinoid)
    Fluorescence intensity and relative percentage of DOM components in different treatments
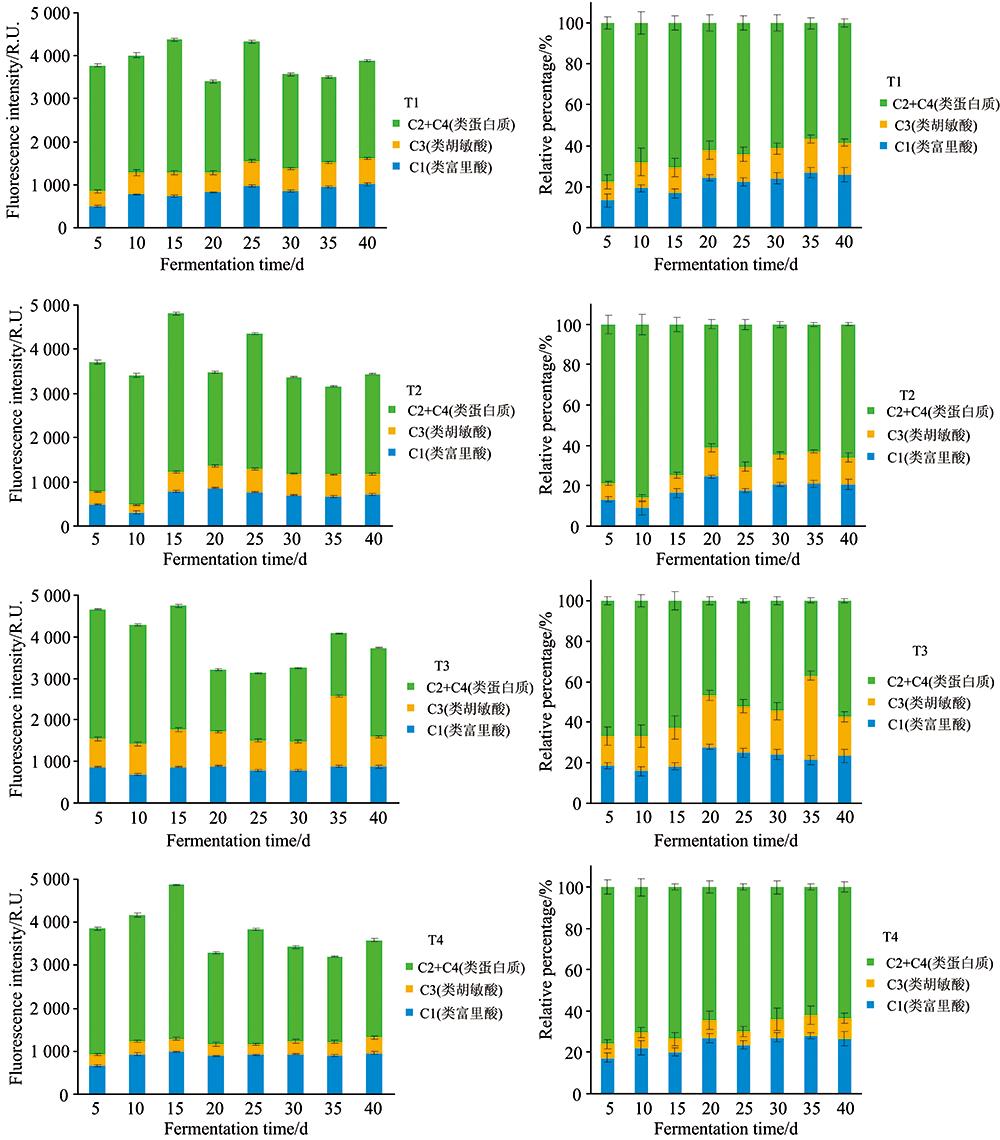
    Fig. 2. Fluorescence intensity and relative percentage of DOM components in different treatments
    材料C含量/%N含量/%C/N含水率/%pH值
    玉米秸秆39.98±4.321.32±0.1130.28±3.9212.89±0.957.06±0.03
    牛粪39.01±3.982.65±0.0915.24±2.0134.72±4.558.55±0.05
    Table 1. Basic physiochenmical properties of corn straw and cow dung
    处理荧光指数FI自生源指数BIX腐殖化指数HIX
    T11.871±0.0110.862±0.0080.608±0.005D
    T21.808±0.0890.856±0.0040.656±0.005C
    T31.926± 0.0100.848±0.0060.975±0.006A
    T41.907± 0.0040.901±0.0040.787±0.009B
    Table 2. Fluorescence spectrum indices of DOM
    DOM荧光
    组分
    组分类型研究对应
    λex/λem/nm
    荧光峰
    C1紫外光区类富里酸
    可见光区类富里酸
    230/415~430
    300~325/415
    A
    C
    C2短波类色氨酸(类蛋白质)
    长波类色氨酸
    225/330~345
    275/330~345
    T
    T1
    C3类胡敏酸250~275/455, 340~370/455F
    C4类酪氨酸(类蛋白质)220/303B
    Table 3. Characteristics of DOM fluoresceoce components in different treatments
    处理DOM荧光组分DOM荧光组分
    C1(类富
    里酸)
    C3(类胡
    敏酸)
    C2+C4
    (类蛋白质)
    C1(类富里酸)1
    T1C3(类胡敏酸)0.879**1
    C2+C4(类蛋白质)-0.590-0.2601
    C1(类富里酸)1
    T2C3(类胡敏酸)0.910**1
    C2+C4(类蛋白质)-0.164-0.4051
    C1(类富里酸)1
    T3C3(类胡敏酸)0.937**1
    C2+C4(类蛋白质)-0.189-0.3641
    C1(类富里酸)1
    T4C3(类胡敏酸)0.853**1
    C2+C4(类蛋白质)-0.030-0.2341
    Table 4. Correlations between different fluorescence components
    Yan LI, Dan WEI, Wei WANG, Liang JIN, Jian-li DING, Shan-shan CAI, Yu HU, Yang BAI. Fluorescence Spectroscopy Characteristics of Dissolved Organic Matter Analysis of Straw-Cow Dung Fermentation in Different Proportion[J]. Spectroscopy and Spectral Analysis, 2021, 41(9): 2846
    Download Citation