
linghuan Liang, Yingxiong Song, Rujian Lin. Demonstration of Coherent Orthogonal Frequency Division Multiplexing Passive Optical Network System Based on Optical Frequency Comb and Injection Locking Local Laser[J]. Acta Optica Sinica, 2019, 39(9): 0906004
- Acta Optica Sinica
- Vol. 39, Issue 9, 0906004 (2019)
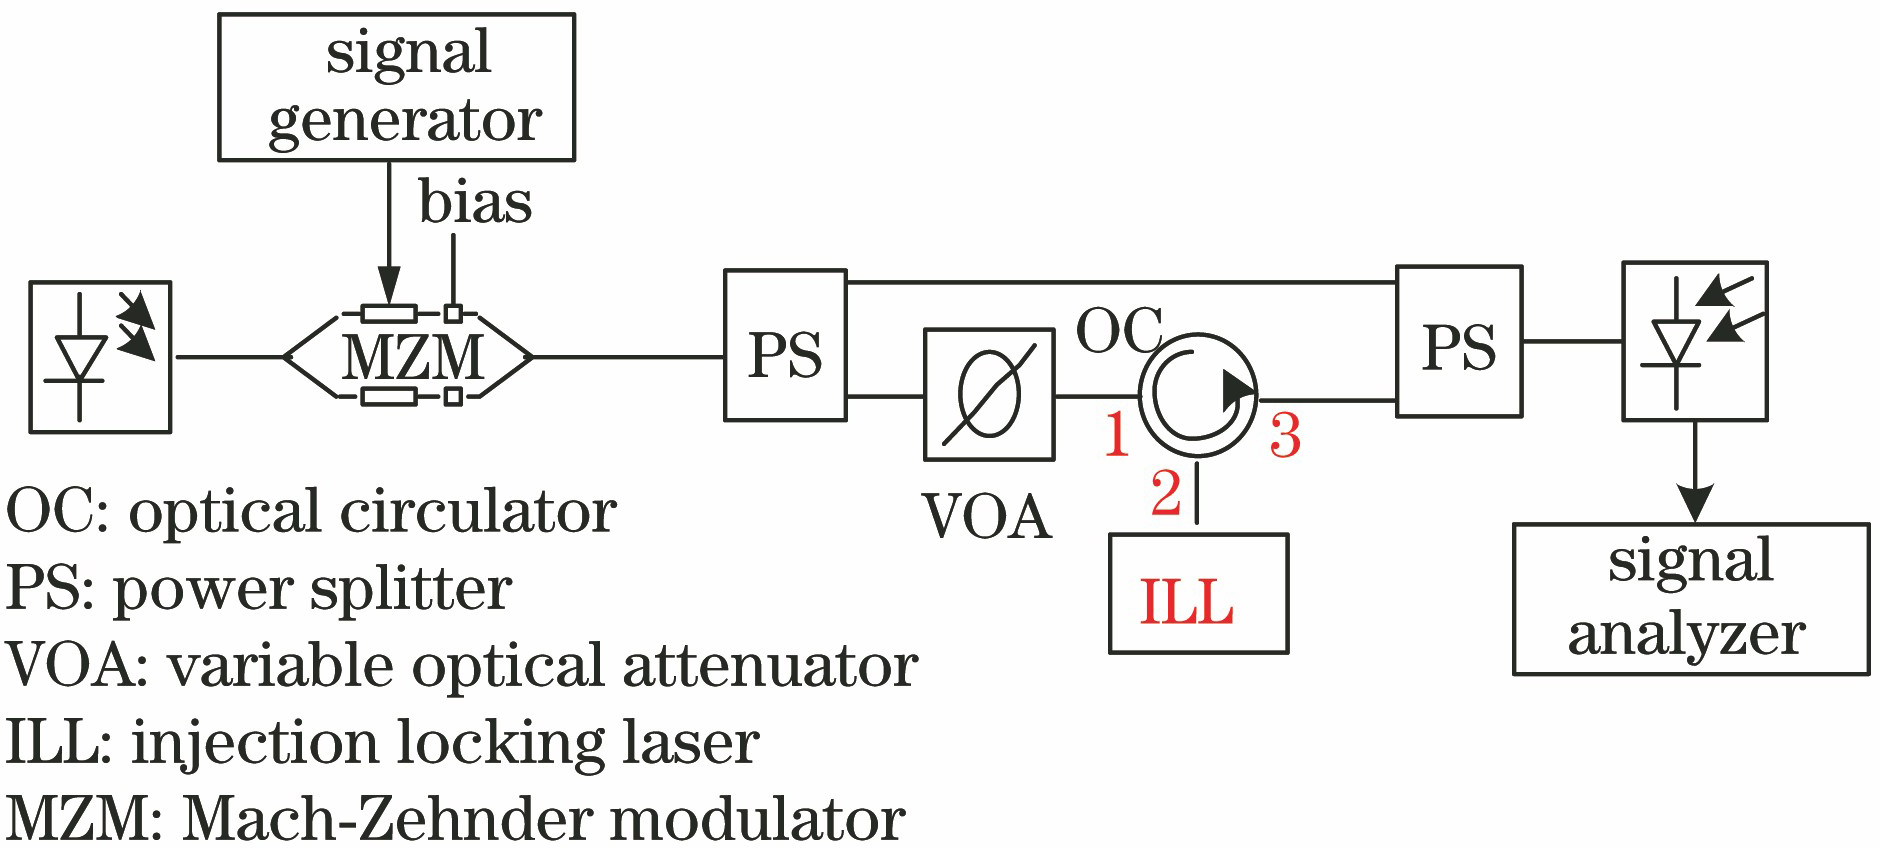
Fig. 1. Experimental setup for measurement of relationship between locking range and injection ratio

Fig. 2. Locking range versus injection ratio
Fig. 3. Optical spectra of master laser and slave laser with injection locking and free running. (a) Wide-linewidth slave laser; (b) narrow-linewidth slave laser
Fig. 4. Coherent OFDM-PON system based on OFC and injection locking local laser
Fig. 5. Polarization control schemes in injection locking. (a) Self-feedback polarization tracker scheme; (b) polarization independent module scheme
Fig. 6. Schematic of I/Q modulator
Fig. 7. Modulation characteristics of I/Q modulator
Fig. 8. Frequency distribution of the composite triple beat number
Fig. 9. Schematic of polarization diversity coherent optical detection module
Fig. 10. Power spectrum of intermediate carrier and OFDM lower sub-band signal
Fig. 11. Schematic of down conversion system
Fig. 12. Power spectrum of intermediate carrier
Fig. 13. Power spectrum of base band OFDM signal
Fig. 14. BER performance versus OFDM signal power
Fig. 15. BER performance versus LO power
Fig. 16. BER performance versus injection ratio
Fig. 17. BER performance versus received optical power of different systems
|
Table 1. Experimental OFDM system parameters

Set citation alerts for the article
Please enter your email address
© Copyright 2018-2021 | Chinese Laser Press. All Rights Reserved 沪ICP备15018463号-20