
Tao Li, Mingyang Li, Junming Huang. Quantum Fisher information of triphoton states[J]. Chinese Optics Letters, 2016, 14(3): 032701
- Chinese Optics Letters
- Vol. 14, Issue 3, 032701 (2016)
![Curves give uncertainty in S^1 and 4(ΔS^1)2 as a function of T(=TV/TH). The dashed line corresponds to the desired pure state, while the solid curves represent the mixed states with background terms taken into consideration. Different colors means different percentages of the desired state in the mixed state. The points represent Shalm’s experimental data[18].](/richHtml/col/2016/14/3/032701/img_001.jpg)
Fig. 1. Curves give uncertainty in S ^ 1 4 ( Δ S ^ 1 ) 2 T ( = T V / T H )
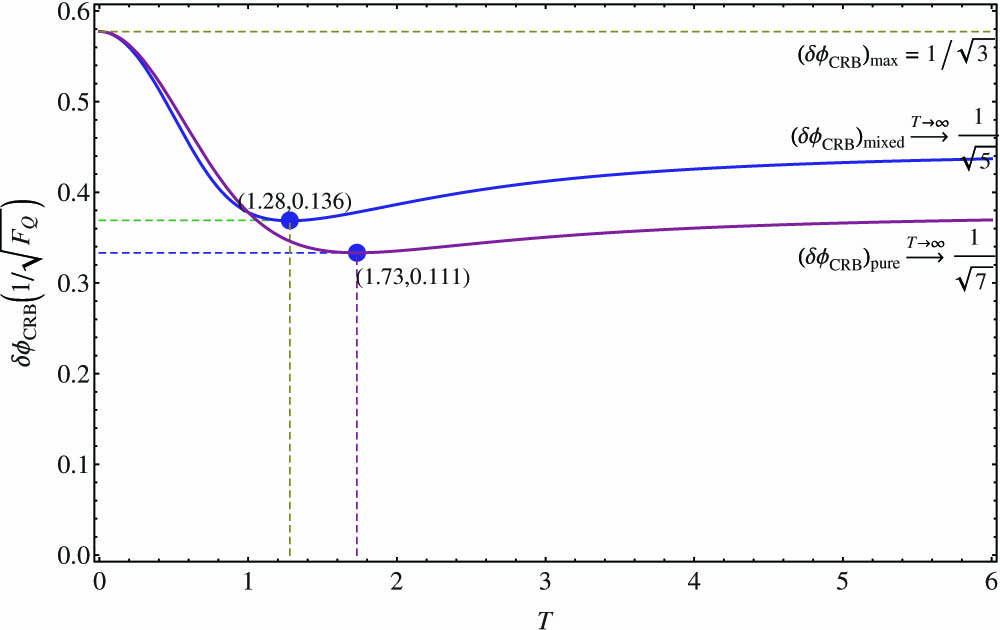
Fig. 2. Curves give δ CRB T λ 1 = 0.5

Set citation alerts for the article
Please enter your email address
© Copyright 2018-2021 | Chinese Laser Press. All Rights Reserved 沪ICP备15018463号-20