
Zihao Li, Zhipeng Yu, Hui Hui, Huanhao Li, Tianting Zhong, Honglin Liu, Puxiang Lai, "Edge enhancement through scattering media enabled by optical wavefront shaping," Photonics Res. 8, 954 (2020)
- Photonics Research
- Vol. 8, Issue 6, 954 (2020)
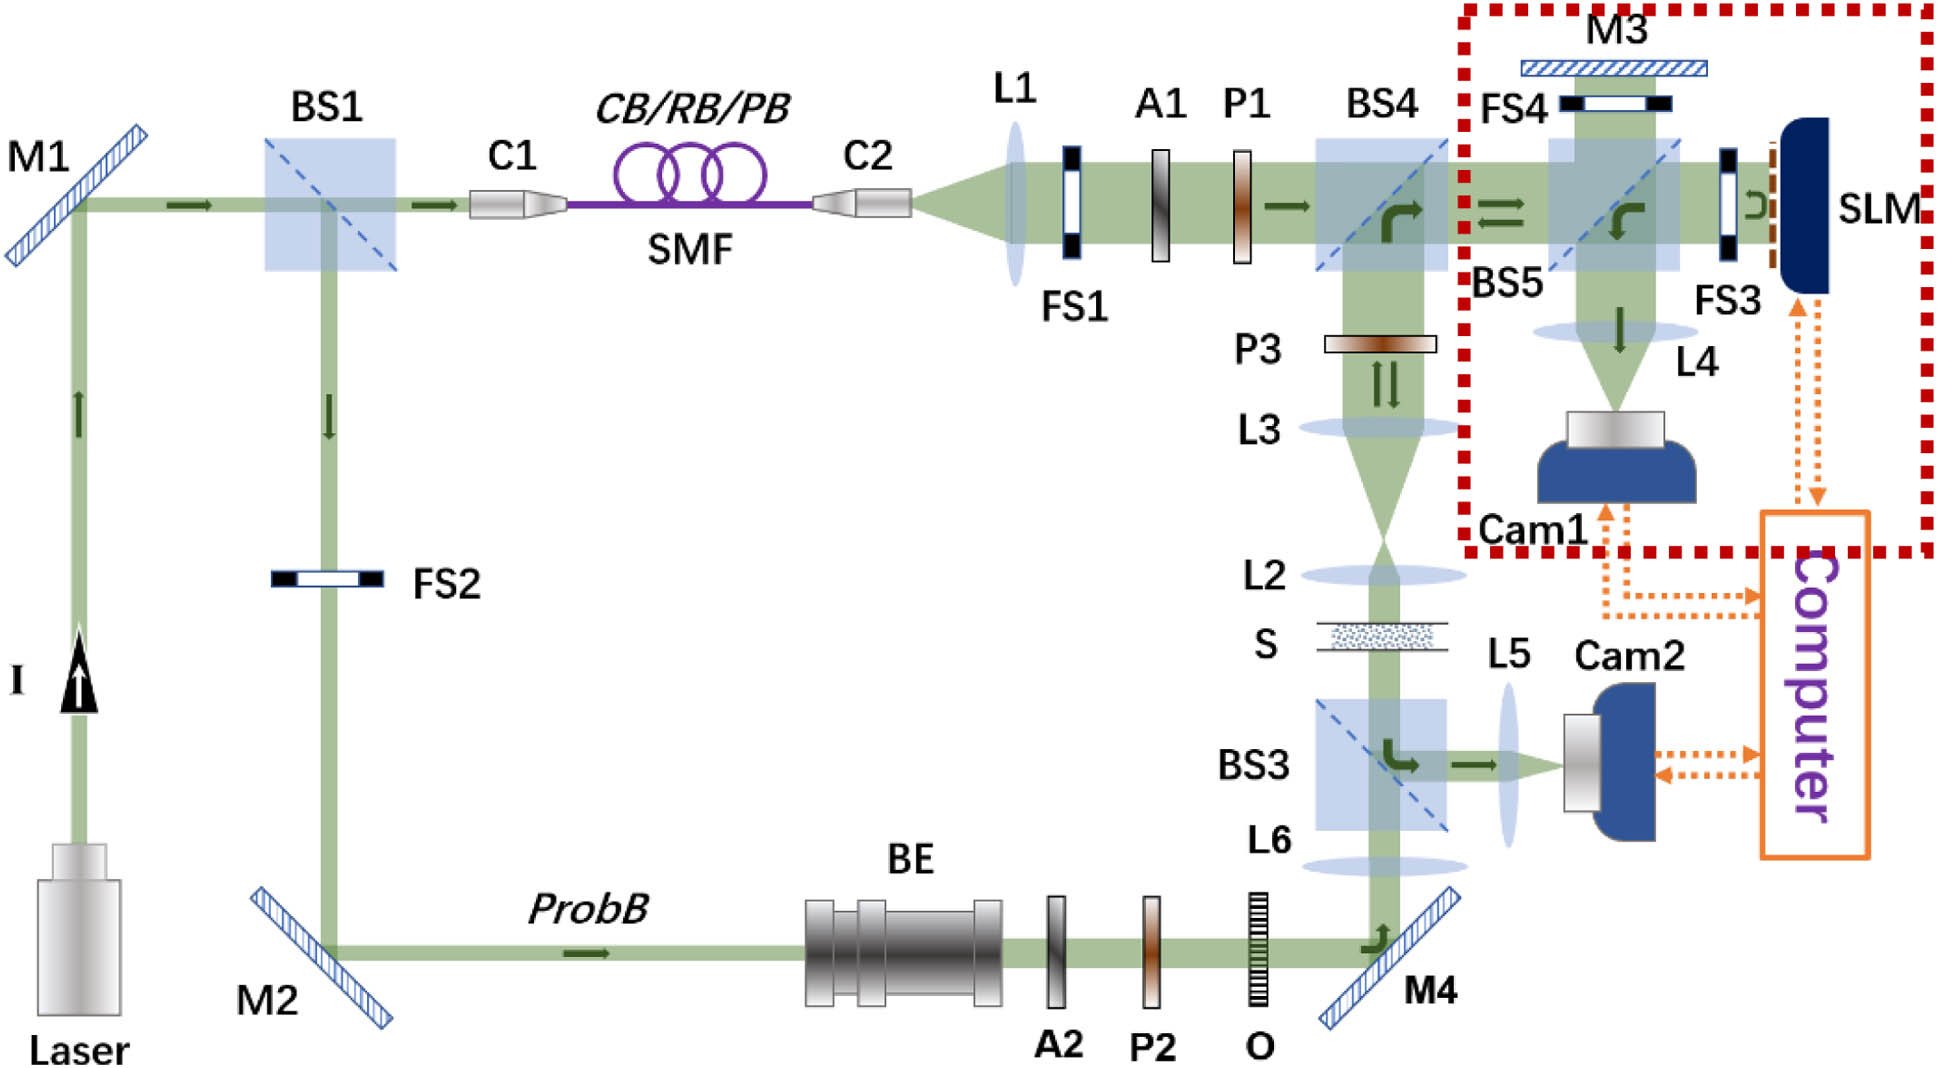
Fig. 1. System setup of DOPC. A 1 − 2 BS 1 − 5 C 1 − 2 Cam 1 Cam 2 FS 1 − 4 L 1 − 3 , 5 , 6 L 4 λ = 532 nm M 1 − 4 P 1 − 3
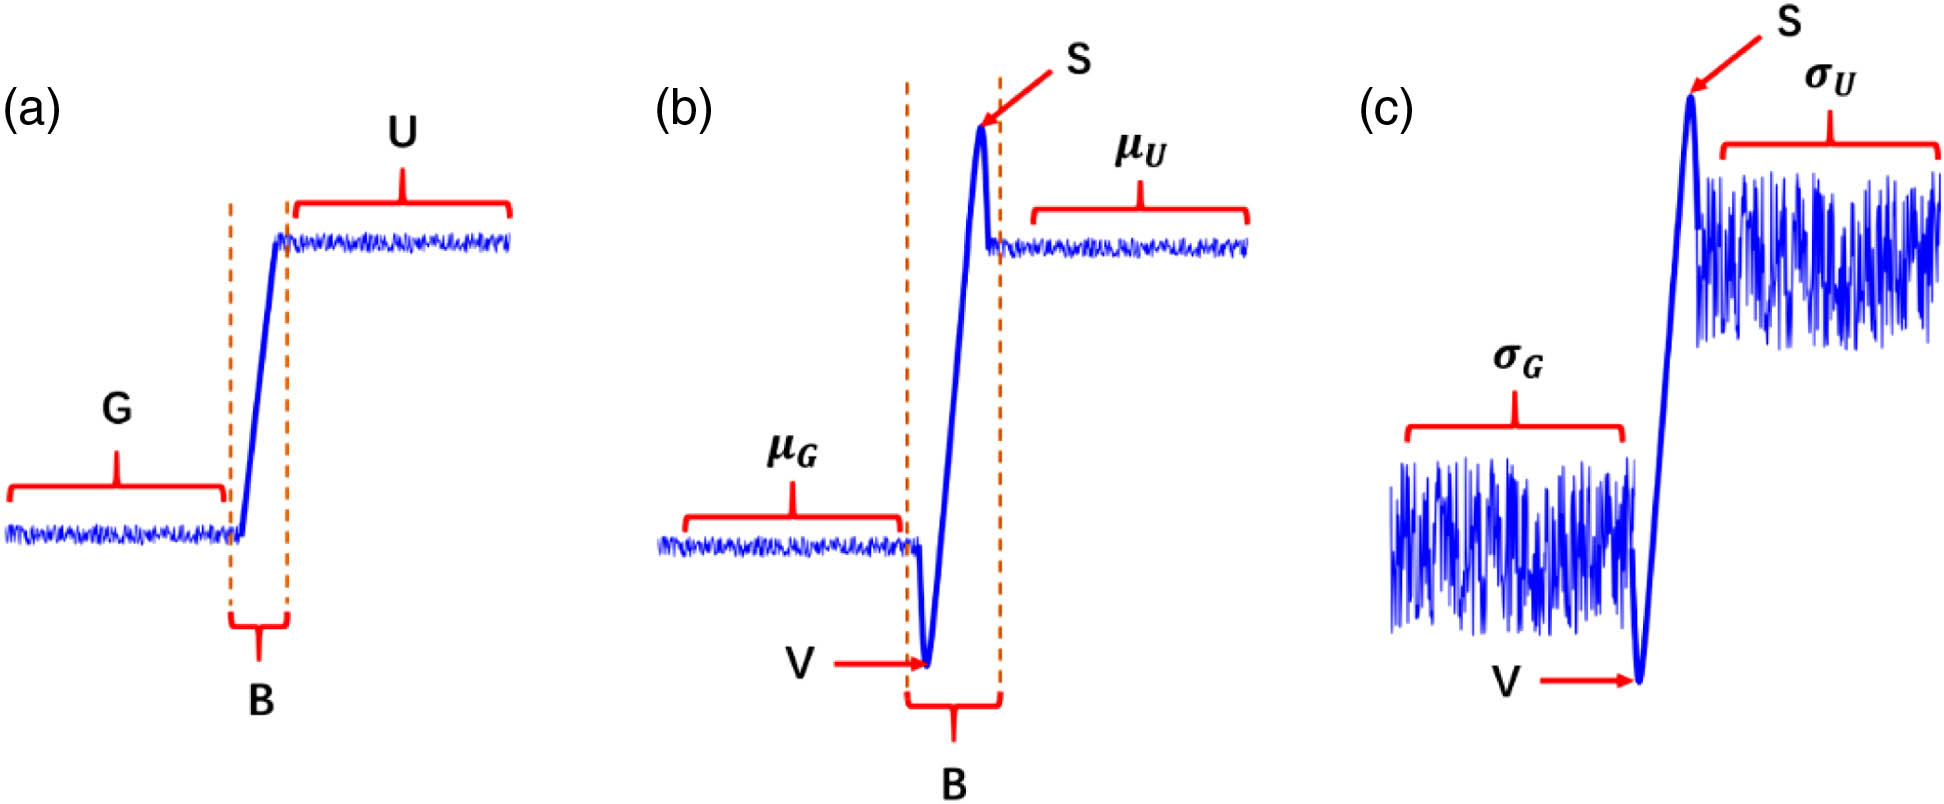
Fig. 2. Anatomy and metrics of an edge. (a) A regular unenhanced edge can be divided into three portions, including ground level (G), brink (B), and upper level (U). The lengths of G and U occupy 30 pixels in our experiment. (b) For an enhanced edge, the maximum and minimum pixel intensities of the portion B are termed as summit (S ) and valley (V ). To quantify the absolute edge enhancement effect, the concept of edge enhancement index EI = ( S − V ) / ( S + V ) ( μ U − μ G ) / ( μ U + μ G ) μ U μ G ENR = S − V σ U 2 + σ G 2 σ U σ G
Fig. 3. Intensity profile of the probe beam before and after transmitting through the scattering medium. (a) Intensity profile of the incident probe beam, a quasi-binary pattern of number “0”, shaped by the resolution test chart. Three horizontal white dashed primitive lines (1–3) with the length of 280 pixels are created. The intensity distributions along the lines 1–3 are, respectively, shown in (b)–(d). A and B denote the inner and outer rim of the pattern “0”, respectively. For edge B, the mean EI and ENR are calculated as 0.91 and 42.77, correspondingly. U, upper level; B, brink; G, ground level; S , summit; V , valley. (e) Intensity profile of the probe beam after penetrating a ground glass diffuser, which is a seemingly random speckle pattern with no obvious edge profile that can be found. Scale bar, 500 μm.
Fig. 4. DOPC-based edge enhancement through scattering media. Five images, (a), (e), (i), (m), (q) are recorded by the CMOS camera (Cam 2 1 ) in the playback stage. The intensity ratio ( r )
Fig. 5. Edge enhancement index (EI) and edge enhancement-to-noise ratio (ENR) of edge B for different values of r x lg ( r )
Fig. 6. (a) Schematic diagram illustrating how the intensity ratio between two optical beams affects the resolvability of phase by the interferogram. Different types of vectors represent the electric field of different beams, as presented by the legend. Δ Ø 1 , 2 r r = I a I b


Set citation alerts for the article
Please enter your email address

© Copyright 2018-2021 | Chinese Laser Press. All Rights Reserved 沪ICP备15018463号-20