• Spectroscopy and Spectral Analysis
  • Vol. 41, Issue 12, 3881 (2021)
Liang-xiao CHENG1、*, Jin-hua TAO1、1; *;, Hai-jin ZHOU3、3;, Chao YU1、1;, Meng FAN1、1;, Ya-peng WANG4、4;, Zhi-bao WANG5、5;, and Liang-fu CHEN1、1;
Author Affiliations
  • 11. State Key Laboratory of Remote Sensing Science, Aerospace Information Research Institute, Chinese Academy of Sciences, Beijing Normal University, Beijing 100101, China
  • 33. Key Laboratory of Environmental Optics and Technology, Anhui Institute of Optics and Fine Mechanics, Chinese Academy of Sciences, Hefei 230031, China 4. National Satellite Meteorological Center, China Meteorological Administration, Beijing 100081, China
  • 4[in Chinese]
  • 55. School of Computer and Information Technology, Northeast Petroleum University, Daqing 163318, China
  • show less
    DOI: 10.3964/j.issn.1000-0593(2021)12-3881-06 Cite this Article
    Liang-xiao CHENG, Jin-hua TAO, Hai-jin ZHOU, Chao YU, Meng FAN, Ya-peng WANG, Zhi-bao WANG, Liang-fu CHEN. Evaluations of Environmental Trace Gases Monitoring Instrument (EMI) Level 1 Data[J]. Spectroscopy and Spectral Analysis, 2021, 41(12): 3881 Copy Citation Text show less
    Sketch map of EMI VIS1 band observation
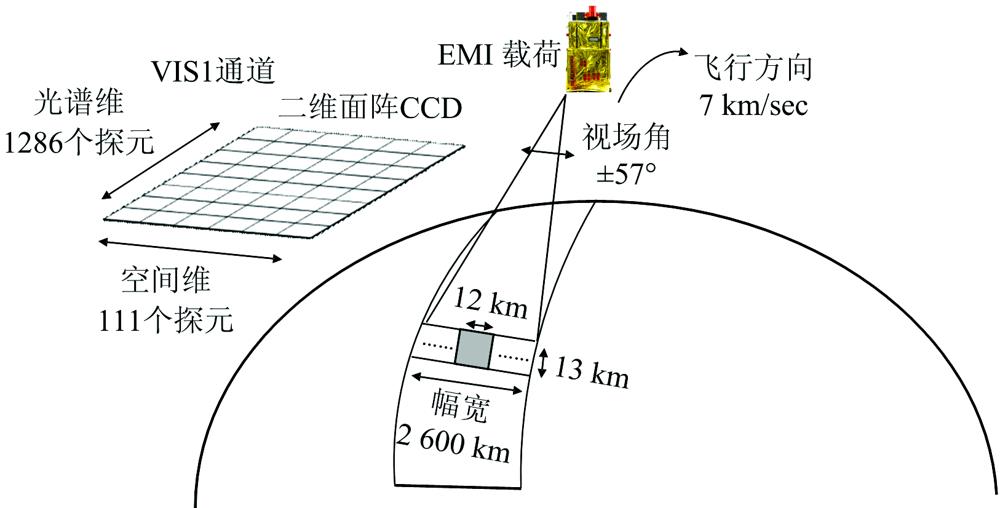
    Fig. 1. Sketch map of EMI VIS1 band observation
    Slit function of different sub-windows in UV and VIS bands as a function of row
    Fig. 2. Slit function of different sub-windows in UV and VIS bands as a function of row
    Irradiance wavelength shift of different sub-windows in the spectral range of 312~356 nm as a function of row
    Fig. 3. Irradiance wavelength shift of different sub-windows in the spectral range of 312~356 nm as a function of row
    Radiance wavelength shift of 12 consecutive orbits measured by UV2 and VIS1 band on 4 August, 2018
    Fig. 4. Radiance wavelength shift of 12 consecutive orbits measured by UV2 and VIS1 band on 4 August, 2018
    The irradiance spectra measured by EMI, OMI and TROPOMI on 12 July, 2018. The black line is a reference solar irradiance from and convolved with the EMI FWHM
    Fig. 5. The irradiance spectra measured by EMI, OMI and TROPOMI on 12 July, 2018. The black line is a reference solar irradiance from and convolved with the EMI FWHM
    Mean radiance of nadir pixelin the clean Pacific region measured on 4 August, 2018
    Fig. 6. Mean radiance of nadir pixelin the clean Pacific region measured on 4 August, 2018
    Irradiance row dependence relative to nadir measured on 12 July, 2018
    Fig. 7. Irradiance row dependence relative to nadir measured on 12 July, 2018
    (a), (c) The normalized measured radiance and the corresponding simulated radiance as a function of row; (b), (d) The ratio of the measured radiance and the simulated radiance and the radiance row dependency
    Fig. 8. (a), (c) The normalized measured radiance and the corresponding simulated radiance as a function of row; (b), (d) The ratio of the measured radiance and the simulated radiance and the radiance row dependency
    SubwindowEMI
    UV2
    OMI
    UV2
    TROPOMI
    BAND3
    EMI
    VIS1
    OMI
    VIS
    TROPOMI
    BAND4
    1312~326 nm405~425 nm
    2325~335 nm425~445 nm
    3327~356 nm445~465 nm
    Table 1. Sub-window settings for irradiance wavelength calibration
    Liang-xiao CHENG, Jin-hua TAO, Hai-jin ZHOU, Chao YU, Meng FAN, Ya-peng WANG, Zhi-bao WANG, Liang-fu CHEN. Evaluations of Environmental Trace Gases Monitoring Instrument (EMI) Level 1 Data[J]. Spectroscopy and Spectral Analysis, 2021, 41(12): 3881
    Download Citation