• Journal of Semiconductors
  • Vol. 44, Issue 2, 024101 (2023)
Ling Yang1, Yizheng Huang1、2, Zhigang Song1、2, Manqing Tan1、2, Yude Yu1、2、3, and Zhao Li1、2、3、*
Author Affiliations
  • 1Institute of Semiconductors, Chinese Academy of Sciences, Beijing 100083, China
  • 2College of Materials Science and Opto-Electronic Technology, University of Chinese Academy of Sciences, Beijing 100049, China
  • 3Beijing Key Laboratory of Genome and Precision Medicine Technologies, Beijing 100101, China
  • show less
    DOI: 10.1088/1674-4926/44/2/024101 Cite this Article
    Ling Yang, Yizheng Huang, Zhigang Song, Manqing Tan, Yude Yu, Zhao Li. A 640 × 640 ISFET array for detecting cell metabolism[J]. Journal of Semiconductors, 2023, 44(2): 024101 Copy Citation Text show less
    (Color online) Schematic cross-section of a p-type ISFET.
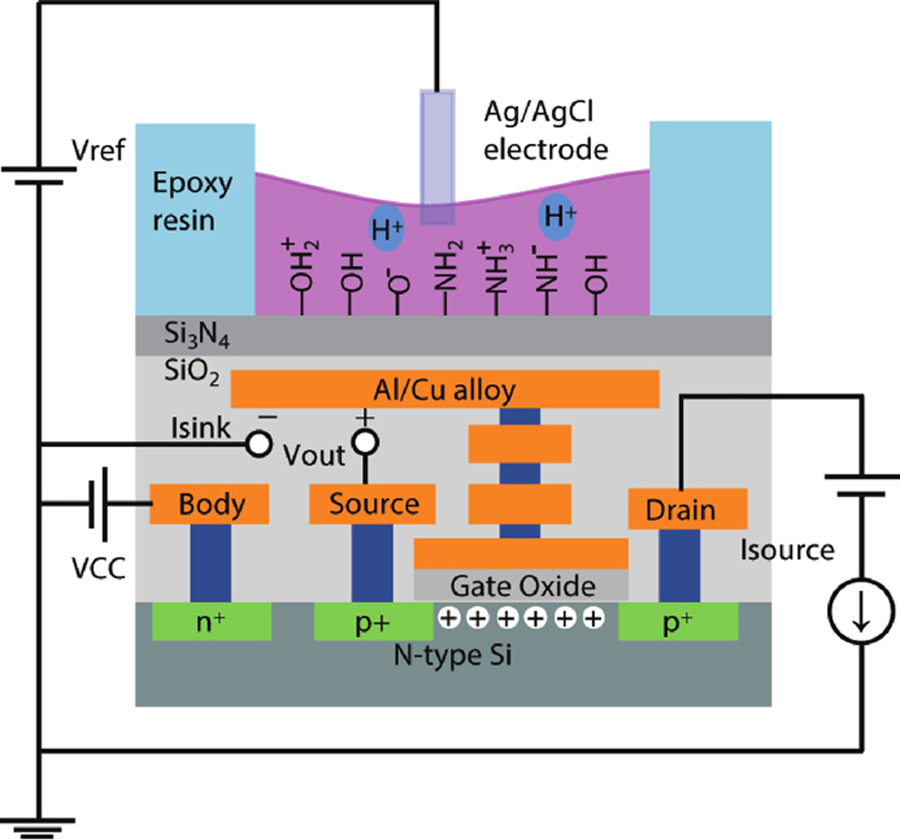
    Fig. 1. (Color online) Schematic cross-section of a p-type ISFET.
    (Color online) Circuits and layout design of the chip. (a) The basic readout circuit of a unit. (b) Circuit diagram of the array. Although the odd and even columns are geometrically crossed and closed to each other, they are logically separated. The signals of the odd and even columns are sent to Vout1 and Vout2 terminals through the upper and lower electrical channels, respectively. (c) Pixels and readout circuit design of one column. (d) A top view of the chip layout.
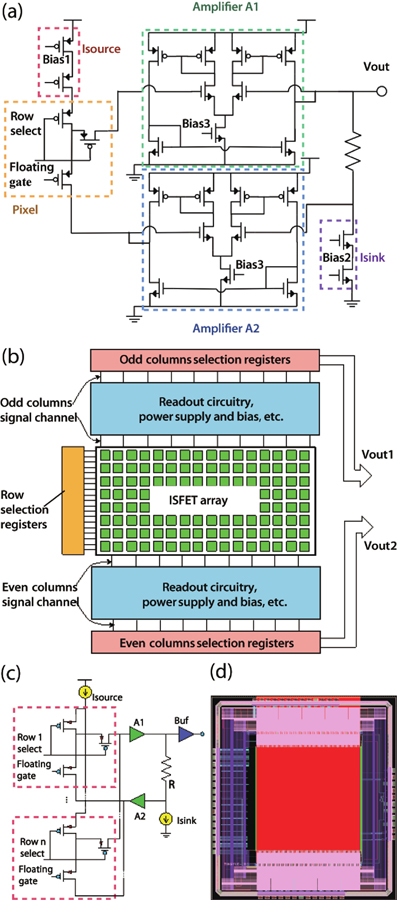
    Fig. 2. (Color online) Circuits and layout design of the chip. (a) The basic readout circuit of a unit. (b) Circuit diagram of the array. Although the odd and even columns are geometrically crossed and closed to each other, they are logically separated. The signals of the odd and even columns are sent to Vout1 and Vout2 terminals through the upper and lower electrical channels, respectively. (c) Pixels and readout circuit design of one column. (d) A top view of the chip layout.
    (Color online) Images of the ISFET array after encapsulation and welding. Regions outlined with boxes of different colors were displayed in the figures of the corresponding colors. (a) Image of the chip encapsulated in a QFP shell. (b) Details of the chip. It includes a pixel array (middle), readout circuits and column selection circuits (top and bottom), and row selection registers (left). (c) A small portion of the pixel array was imaged under a microscope. Each pixel is 7.4 × 7.4µm2. (d) The SEM micrograph of the passivation layer. The top layer Si3N4 is used as the sensing layer.
    Fig. 3. (Color online) Images of the ISFET array after encapsulation and welding. Regions outlined with boxes of different colors were displayed in the figures of the corresponding colors. (a) Image of the chip encapsulated in a QFP shell. (b) Details of the chip. It includes a pixel array (middle), readout circuits and column selection circuits (top and bottom), and row selection registers (left). (c) A small portion of the pixel array was imaged under a microscope. Each pixel is 7.4 × 7.4µm2. (d) The SEM micrograph of the passivation layer. The top layer Si3N4 is used as the sensing layer.
    (Color online) Signals of the ISFET array. (a) Initial signals of the ISFET array after UV irradiation with a reference voltage of 0 V. (b) Signal values decreased when the reference voltage was regulated to –4.0 V.
    Fig. 4. (Color online) Signals of the ISFET array. (a) Initial signals of the ISFET array after UV irradiation with a reference voltage of 0 V. (b) Signal values decreased when the reference voltage was regulated to –4.0 V.
    (Color online) Ion imaging of dynamic flow process. (a) All sensitive pixels had uniform signals initially. (b–e) Once the buffer was injected into the chip, signals of the pixels in contact with the buffer changed immediately. (f) The buffer was evenly distributed across the surface, so each pixel had a similar output signal.
    Fig. 5. (Color online) Ion imaging of dynamic flow process. (a) All sensitive pixels had uniform signals initially. (b–e) Once the buffer was injected into the chip, signals of the pixels in contact with the buffer changed immediately. (f) The buffer was evenly distributed across the surface, so each pixel had a similar output signal.
    (Color online) (a) Voltage signals of six pH values for 1000 pixels. Each of the 1000 pixels was picked from the array per 20 rows and 20 columns, which could ensure the pixels were uniformly distributed. Each step is 20 acquired data in about 25 s, and the washing time is not included. The 20 acquired data were averaged to calculate the pH sensitivity of a pixel. (b) The pH-to-output voltage curve for the same pixels in (a). Each point is the mean value of the pixels, and the error bar is also calculated from the data.
    Fig. 6. (Color online) (a) Voltage signals of six pH values for 1000 pixels. Each of the 1000 pixels was picked from the array per 20 rows and 20 columns, which could ensure the pixels were uniformly distributed. Each step is 20 acquired data in about 25 s, and the washing time is not included. The 20 acquired data were averaged to calculate the pH sensitivity of a pixel. (b) The pH-to-output voltage curve for the same pixels in (a). Each point is the mean value of the pixels, and the error bar is also calculated from the data.
    (Color online) The repeatability measurement results of commercial buffers with different pHs of 4.01, 7.00, and 9.21.
    Fig. 7. (Color online) The repeatability measurement results of commercial buffers with different pHs of 4.01, 7.00, and 9.21.
    (Color online) Cell culture process and data analysis. (a) The pH changes of medium samples. (b) Photograph of CaSki cell culture medium within 4 days. (c) Micrographs of the cell proliferation status during 4 days.
    Fig. 8. (Color online) Cell culture process and data analysis. (a) The pH changes of medium samples. (b) Photograph of CaSki cell culture medium within 4 days. (c) Micrographs of the cell proliferation status during 4 days.
    Ling Yang, Yizheng Huang, Zhigang Song, Manqing Tan, Yude Yu, Zhao Li. A 640 × 640 ISFET array for detecting cell metabolism[J]. Journal of Semiconductors, 2023, 44(2): 024101
    Download Citation