• Laser & Optoelectronics Progress
  • Vol. 60, Issue 7, 0712001 (2023)
Xin Liu, Dahai Li*, Xinwei Zhang, Renhao Ge, and Ziliang Yan
Author Affiliations
  • College of Electronics and Information Engineering, Sichuan University, Chengdu 610065, Sichuan, China
  • show less
    DOI: 10.3788/LOP220567 Cite this Article Set citation alerts
    Xin Liu, Dahai Li, Xinwei Zhang, Renhao Ge, Ziliang Yan. Deflectometry-Based Investigation of Radius of Curvature of Convex Spherical Elements Testing Method[J]. Laser & Optoelectronics Progress, 2023, 60(7): 0712001 Copy Citation Text show less
    Schematic diagram. (a) PMD measurement system; (b) principle of acquiring coordinates of spherical reflection points
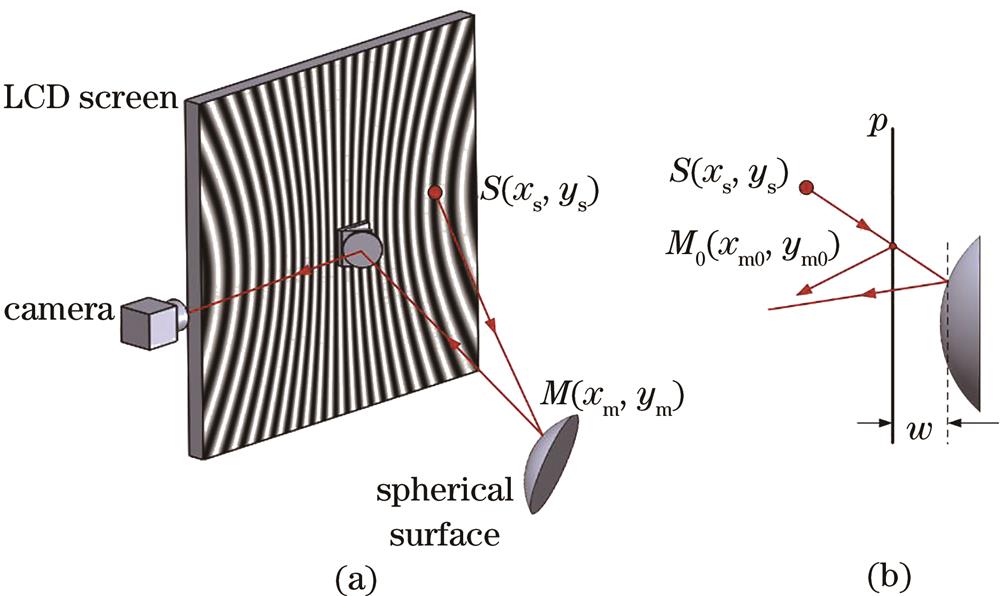
    Fig. 1. Schematic diagram. (a) PMD measurement system; (b) principle of acquiring coordinates of spherical reflection points
    Schematic for generating pre-distortion fringe
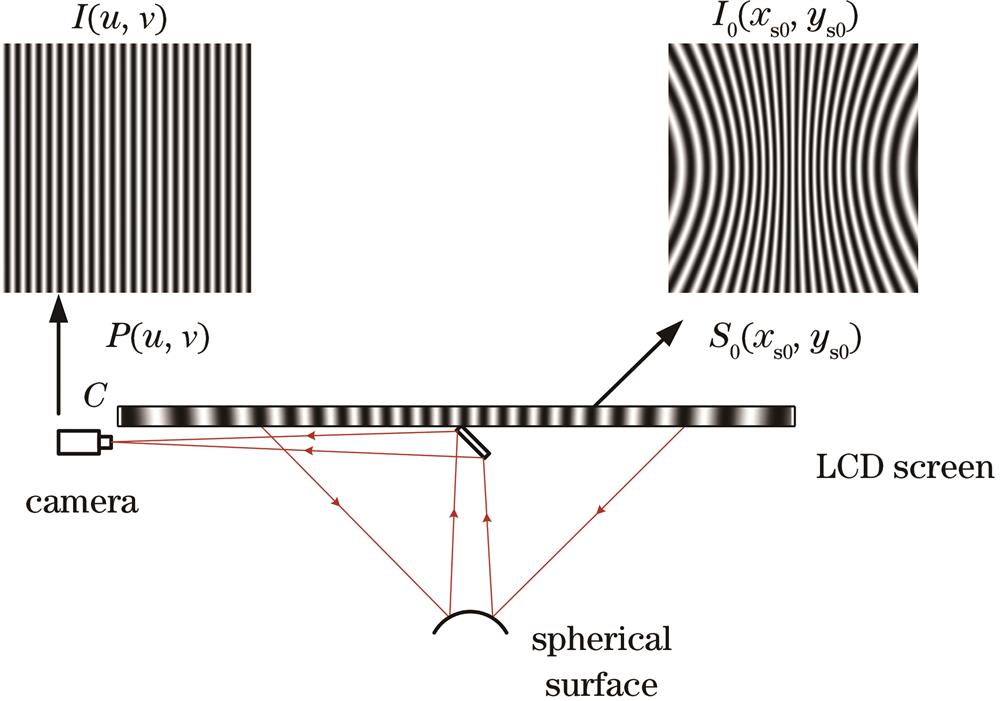
    Fig. 2. Schematic for generating pre-distortion fringe
    Fringe projected by the LCD and captured by the camera. (a) Standard sine fringe in horizontal and vertical directions, respectively; (b) pre-distortion fringe in horizontal and vertical directions, respectively; (c) fringe captured by the camera when projecting standard sine fringe horizontally and vertically, respectively; (d) fringe captured by the camera when projecting pre-distortion fringe horizontally and vertically, respectively
    Fig. 3. Fringe projected by the LCD and captured by the camera. (a) Standard sine fringe in horizontal and vertical directions, respectively; (b) pre-distortion fringe in horizontal and vertical directions, respectively; (c) fringe captured by the camera when projecting standard sine fringe horizontally and vertically, respectively; (d) fringe captured by the camera when projecting pre-distortion fringe horizontally and vertically, respectively
    Unwrapping phase. (a) (b) Horizontal and vertical unwrapped phases of the fringe captured by the camera when projecting standard sine fringe, respectively; (c) (d) horizontal and vertical unwrapped phases of the fringe captured by the camera when projecting pre-distortion fringe, respectively
    Fig. 4. Unwrapping phase. (a) (b) Horizontal and vertical unwrapped phases of the fringe captured by the camera when projecting standard sine fringe, respectively; (c) (d) horizontal and vertical unwrapped phases of the fringe captured by the camera when projecting pre-distortion fringe, respectively
    Calculated ROC. (a) ROC obtained by projecting a standard sine fringe; (b) ROC obtained by projecting pre-distortion fringe
    Fig. 5. Calculated ROC. (a) ROC obtained by projecting a standard sine fringe; (b) ROC obtained by projecting pre-distortion fringe
    PV and RMS calculated with different ROC values
    Fig. 6. PV and RMS calculated with different ROC values
    Experimental setup for measuring the ROC of spherical element
    Fig. 7. Experimental setup for measuring the ROC of spherical element
    Fringe captured by the camera. (a) (b) Fringe captured by the camera when projecting standard sine fringe and pre-distortion fringe in the vertical direction, respectively; (c) (d) fringe captured by the camera when projecting standard sine fringe and pre-distortion fringe in the horizontal direction, respectively
    Fig. 8. Fringe captured by the camera. (a) (b) Fringe captured by the camera when projecting standard sine fringe and pre-distortion fringe in the vertical direction, respectively; (c) (d) fringe captured by the camera when projecting standard sine fringe and pre-distortion fringe in the horizontal direction, respectively
    Contrast of fringe. (a) Contrast of fringe captured by the camera when projecting standard sine fringe; (b) contrast of fringe captured by the camera when projecting pre-distortion fringe
    Fig. 9. Contrast of fringe. (a) Contrast of fringe captured by the camera when projecting standard sine fringe; (b) contrast of fringe captured by the camera when projecting pre-distortion fringe
    Mean ROC values measured in the experiment. (a) Result of projection standard sine fringe; (b) result of projection pre-distortion fringe
    Fig. 10. Mean ROC values measured in the experiment. (a) Result of projection standard sine fringe; (b) result of projection pre-distortion fringe
    ROCMeanPVRMS
    66.00010.01220.0031
    77.00140.01200.0030
    88.00210.01170.0029
    99.00320.01160.0029
    1010.00440.01140.0028
    Table 1. Simulation results of spherical surfaces with different ROC values
    Xin Liu, Dahai Li, Xinwei Zhang, Renhao Ge, Ziliang Yan. Deflectometry-Based Investigation of Radius of Curvature of Convex Spherical Elements Testing Method[J]. Laser & Optoelectronics Progress, 2023, 60(7): 0712001
    Download Citation