• Photonics Research
  • Vol. 10, Issue 1, 237 (2022)
Chiara Bonati*, Damien Loterie, Timothé Laforest, and Christophe Moser
Author Affiliations
  • Laboratory of Applied Photonics Devices, School of Engineering, Ecole Polytechnique Fédérale de Lausanne, 1015 Lausanne, Switzerland
  • show less
    DOI: 10.1364/PRJ.445896 Cite this Article Set citation alerts
    Chiara Bonati, Damien Loterie, Timothé Laforest, Christophe Moser. Lock-in incoherent differential phase contrast imaging[J]. Photonics Research, 2022, 10(1): 237 Copy Citation Text show less
    Scheme of operation of lock-in DPC with two illuminations. (a) Simplified DPC microscope scheme during the first half period; the left source SL illuminates the object (O), the transmitted light is collected by the objective (Obj), and an image is formed by the tube lens (TL) on the camera (C). (b) Simplified DPC scheme during the second half period, using the right source SR. (c) Scheme of operation of a heliCam C3 pixel. The signal modulated at frequency 1/T is integrated and sampled four times during each period. The local oscillator (LO) generates two discrete signals: uI is a periodic sequence of [+1, 0, −1, 0], and uQ is the same signal phase shifted by 90°. Discrete multiplication is performed between the sampled signal and each of the two local oscillator signals. The resulting signals are then low-pass filtered (LPF) and averaged in time (AVG), giving at the output the frames I and Q, which are digitized by a 10-bit ADC. To synchronize with the DPC illumination, the two sources SL and SR are switched on and off alternatively over a period T equal to the demodulation period of the lock-in camera. Four samples are taken during one cycle: two while the source SL is on (IL and QL) and two while the source SR is on (IR and QR). If the illumination switches in phase with the local oscillator, I and Q are equal.
    Fig. 1. Scheme of operation of lock-in DPC with two illuminations. (a) Simplified DPC microscope scheme during the first half period; the left source SL illuminates the object (O), the transmitted light is collected by the objective (Obj), and an image is formed by the tube lens (TL) on the camera (C). (b) Simplified DPC scheme during the second half period, using the right source SR. (c) Scheme of operation of a heliCam C3 pixel. The signal modulated at frequency 1/T is integrated and sampled four times during each period. The local oscillator (LO) generates two discrete signals: uI is a periodic sequence of [+1, 0, 1, 0], and uQ is the same signal phase shifted by 90°. Discrete multiplication is performed between the sampled signal and each of the two local oscillator signals. The resulting signals are then low-pass filtered (LPF) and averaged in time (AVG), giving at the output the frames I and Q, which are digitized by a 10-bit ADC. To synchronize with the DPC illumination, the two sources SL and SR are switched on and off alternatively over a period T equal to the demodulation period of the lock-in camera. Four samples are taken during one cycle: two while the source SL is on (IL and QL) and two while the source SR is on (IR and QR). If the illumination switches in phase with the local oscillator, I and Q are equal.
    Lock-in DPC microscope setup. The sample is located at the object plane (OP) of the objective (20×, 0.4 NA) and illuminated with red LED light (LED Engin LZ1 623 nm). The pupil (FP) of the objective is located inside the objective barrel (yellow dashed line) and is relayed with a 4f system (lenses L1 and L2, two identical 180 mm focal length lenses, with 2 in. diameter). A variable aperture (Ap) is located at the relayed pupil to adjust the system’s NA to the maximum illumination angle. With a tube lens (TL, a 200 mm focal length lens, matched to the objective’s specifications) an image is formed at the image plane (IP) where the lock-in camera is located. A beam splitter (BS) is used to form a second arm: there, a second 4f system forms an image of the pupil onto a standard CMOS camera. The zoomed inset shows the scheme of the illumination part of the setup. The light coming from a high-power red LED is focused with a 4f system onto the facet of a hexagonal glass pipe (HP). The light going through this glass pipe is reflected several times and gets scrambled, lighting the output facet with uniform intensity. A knife-edge mirror (KE) is placed at the back focal plane of a collimating lens (CL). This mirror has two reflecting surfaces at a 90° angle, and the edge is also reflecting. This mirror is placed such that the edge crosses the optical axis at the back focal plane. In this way the mirror acts as a Fourier filter that selects only one half of the illumination profile. A focusing lens (FL) is then placed above the KE and it makes an image of the output facet of the HP, at the OP. An identical set of elements is placed on the other side of the KE.
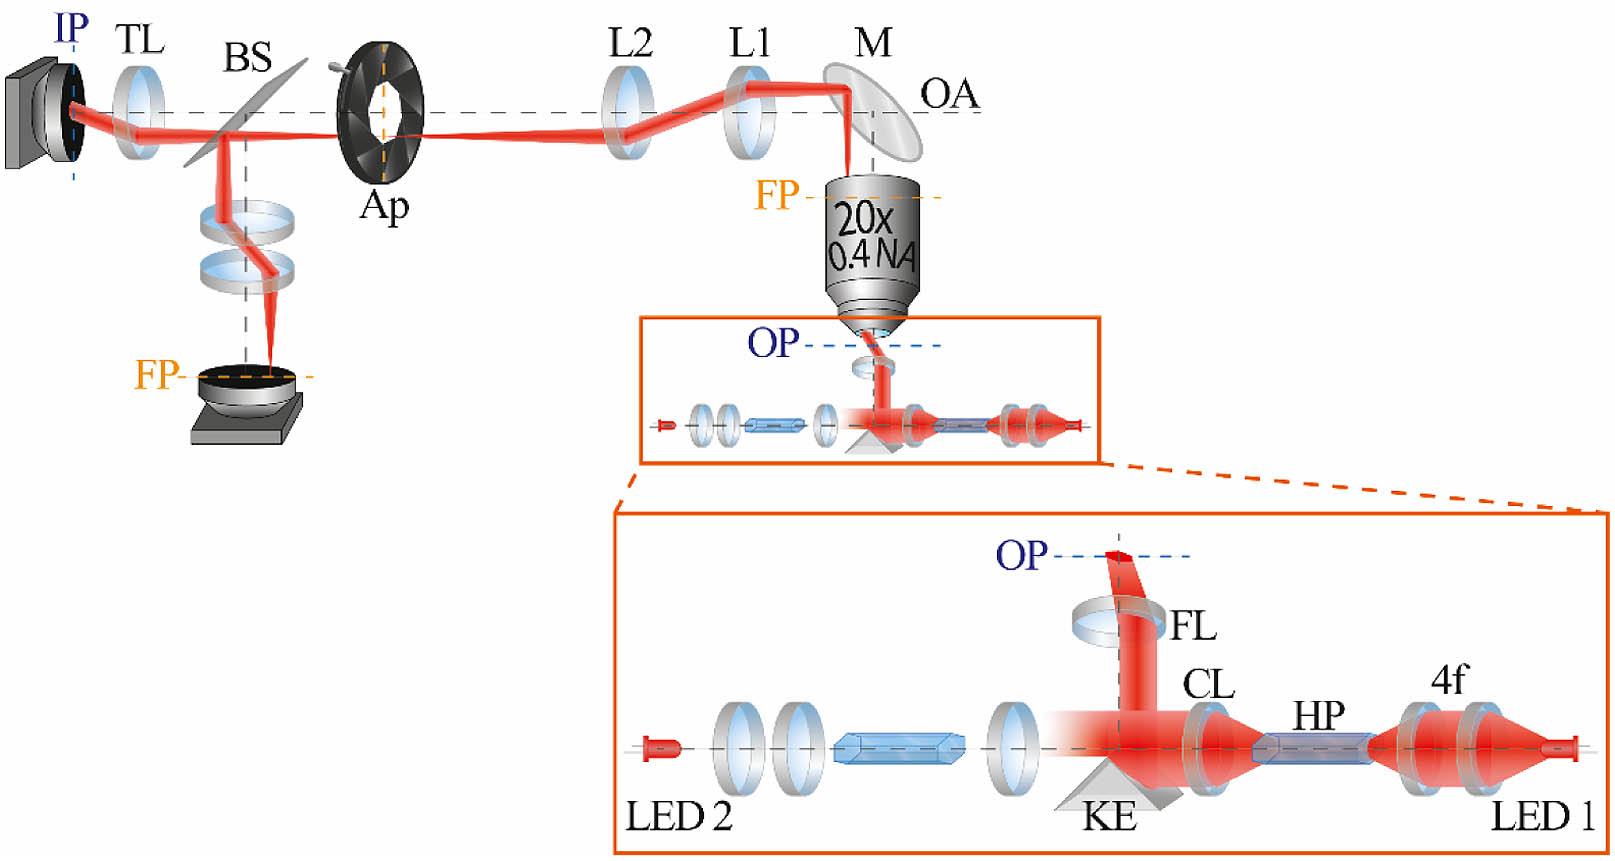
    Fig. 2. Lock-in DPC microscope setup. The sample is located at the object plane (OP) of the objective (20×, 0.4 NA) and illuminated with red LED light (LED Engin LZ1 623 nm). The pupil (FP) of the objective is located inside the objective barrel (yellow dashed line) and is relayed with a 4f system (lenses L1 and L2, two identical 180 mm focal length lenses, with 2 in. diameter). A variable aperture (Ap) is located at the relayed pupil to adjust the system’s NA to the maximum illumination angle. With a tube lens (TL, a 200 mm focal length lens, matched to the objective’s specifications) an image is formed at the image plane (IP) where the lock-in camera is located. A beam splitter (BS) is used to form a second arm: there, a second 4f system forms an image of the pupil onto a standard CMOS camera. The zoomed inset shows the scheme of the illumination part of the setup. The light coming from a high-power red LED is focused with a 4f system onto the facet of a hexagonal glass pipe (HP). The light going through this glass pipe is reflected several times and gets scrambled, lighting the output facet with uniform intensity. A knife-edge mirror (KE) is placed at the back focal plane of a collimating lens (CL). This mirror has two reflecting surfaces at a 90° angle, and the edge is also reflecting. This mirror is placed such that the edge crosses the optical axis at the back focal plane. In this way the mirror acts as a Fourier filter that selects only one half of the illumination profile. A focusing lens (FL) is then placed above the KE and it makes an image of the output facet of the HP, at the OP. An identical set of elements is placed on the other side of the KE.
    Comparison of standard and lock-in DPC images of a 19 mrad USAF target. (a) Region of interest (ROI) of the USAF target measured in standard DPC, after background subtraction and averaging of 280 frames of 1 μs exposure each. (b) ROI of the USAF target measured in lock-in DPC, over a total exposure time of 280 μs, after background subtraction. This image is the sum of the two quadrature images I, Q. (c) Comparison of the cross section of the right-most structure, in lock-in and standard DPC. The blue cross section refers to the lock-in measurement, while the orange cross section refers to a single standard measurement. The inset shows the same cross section for standard DPC, but with a zoomed scale.
    Fig. 3. Comparison of standard and lock-in DPC images of a 19 mrad USAF target. (a) Region of interest (ROI) of the USAF target measured in standard DPC, after background subtraction and averaging of 280 frames of 1 μs exposure each. (b) ROI of the USAF target measured in lock-in DPC, over a total exposure time of 280 μs, after background subtraction. This image is the sum of the two quadrature images I, Q. (c) Comparison of the cross section of the right-most structure, in lock-in and standard DPC. The blue cross section refers to the lock-in measurement, while the orange cross section refers to a single standard measurement. The inset shows the same cross section for standard DPC, but with a zoomed scale.
    (a) CNR, measured as the ratio of maximum and minimum peak of the cross section and the standard deviation of a featureless area, is calculated for several samples and plotted against their phase, for both lock-in and standard DPC, in blue and orange, respectively. The CNR of the standard DPC measurements has been multiplied by 2 to take into account the possibility to increase the exposure time without saturating the 10-bit detector. The error bar is obtained over 100 measurements. The green dashed line represents the sensitivity limit at CNR=1, while the blue dotted line is the extrapolated linear trend of the CNR in lock-in DPC. According to this extrapolation, on the horizontal axis the phase sensitivities of lock-in DPC and standard DPC are shown, in blue and orange, respectively. (b) The ratio of CNR between lock-in and standard DPC is plotted against the phase of several USAF targets. This ratio should be constant, at 8.36, since the ratio of exposure time is 70, considering an extra factor of 4 for the standard measurement exposure time to reach the best-case scenario. The error bars are obtained over 100 measurements. (c) CNR for increasing number of averaged standard DPC frames, compared to a single lock-in acquisition. The top horizontal axis shows how many frames are averaged, while the bottom horizontal axis shows how much time is required in total.
    Fig. 4. (a) CNR, measured as the ratio of maximum and minimum peak of the cross section and the standard deviation of a featureless area, is calculated for several samples and plotted against their phase, for both lock-in and standard DPC, in blue and orange, respectively. The CNR of the standard DPC measurements has been multiplied by 2 to take into account the possibility to increase the exposure time without saturating the 10-bit detector. The error bar is obtained over 100 measurements. The green dashed line represents the sensitivity limit at CNR=1, while the blue dotted line is the extrapolated linear trend of the CNR in lock-in DPC. According to this extrapolation, on the horizontal axis the phase sensitivities of lock-in DPC and standard DPC are shown, in blue and orange, respectively. (b) The ratio of CNR between lock-in and standard DPC is plotted against the phase of several USAF targets. This ratio should be constant, at 8.36, since the ratio of exposure time is 70, considering an extra factor of 4 for the standard measurement exposure time to reach the best-case scenario. The error bars are obtained over 100 measurements. (c) CNR for increasing number of averaged standard DPC frames, compared to a single lock-in acquisition. The top horizontal axis shows how many frames are averaged, while the bottom horizontal axis shows how much time is required in total.
    Reconstructed phase of a 50.6 mrad USAF target. The target was placed with an angle of 25° with respect to the direction of illumination, so that none of the edges were parallel to it. As a consequence, no distortion is caused by the missing frequencies. The ROI is rotated here to show straight rectangles. (a) Reconstructed phase from a single 8 μs exposure standard DPC image. (b) Reconstructed phase from 58 averaged standard DPC frames. (c) Reconstructed phase from a single 464 μs lock-in measurement. (d) Comparison of the cross sections indicated in (b) and (c) with the orange and blue lines.
    Fig. 5. Reconstructed phase of a 50.6 mrad USAF target. The target was placed with an angle of 25° with respect to the direction of illumination, so that none of the edges were parallel to it. As a consequence, no distortion is caused by the missing frequencies. The ROI is rotated here to show straight rectangles. (a) Reconstructed phase from a single 8 μs exposure standard DPC image. (b) Reconstructed phase from 58 averaged standard DPC frames. (c) Reconstructed phase from a single 464 μs lock-in measurement. (d) Comparison of the cross sections indicated in (b) and (c) with the orange and blue lines.
    Phase reconstruction of onion epidermal cells. (a) Reconstruction from a single, 7 μs exposure, standard DPC image. (b) Reconstruction from a single, 120 μs exposure, lock-in DPC image. (c) Reconstruction from a single, 248 μs exposure, lock-in DPC image. Second row: zoom from the areas indicated in the orange squares.
    Fig. 6. Phase reconstruction of onion epidermal cells. (a) Reconstruction from a single, 7 μs exposure, standard DPC image. (b) Reconstruction from a single, 120 μs exposure, lock-in DPC image. (c) Reconstruction from a single, 248 μs exposure, lock-in DPC image. Second row: zoom from the areas indicated in the orange squares.
    (a) Simulated phase sample; (b) simulated image formed under left-illumination conditions (SL); (c) simulated image formed under right-illumination condition (SR); (d) scheme of operation of lock-in DPC, when the synchronization in frequency and phase is correctly done.
    Fig. 7. (a) Simulated phase sample; (b) simulated image formed under left-illumination conditions (SL); (c) simulated image formed under right-illumination condition (SR); (d) scheme of operation of lock-in DPC, when the synchronization in frequency and phase is correctly done.
    (a) Simulated pixel values along a cross section, for standard DPC image recorded over an exposure time T. BS indicates the background value, close to the limit of 1024 in the case of a 10-bit detector; rBS indicates the amplitude of the background non-uniformity. (b) Simulated pixel values along the same cross section, for a lock-in DPC image recorded over an exposure time T. BL indicates the background value, which is approximately 512 if the left–right illuminations are tuned to have the same average power; the non-uniformity is still rBS. (c) Simulated pixel values along the same cross section, for a lock-in DPC image recorded over an exposure time k times of before. The background is still 512 assuming well-tuned illuminations, but the non-uniformity is now increased by the same factor k as the exposure time.
    Fig. 8. (a) Simulated pixel values along a cross section, for standard DPC image recorded over an exposure time T. BS indicates the background value, close to the limit of 1024 in the case of a 10-bit detector; rBS indicates the amplitude of the background non-uniformity. (b) Simulated pixel values along the same cross section, for a lock-in DPC image recorded over an exposure time T. BL indicates the background value, which is approximately 512 if the left–right illuminations are tuned to have the same average power; the non-uniformity is still rBS. (c) Simulated pixel values along the same cross section, for a lock-in DPC image recorded over an exposure time k times of before. The background is still 512 assuming well-tuned illuminations, but the non-uniformity is now increased by the same factor k as the exposure time.
    Standard DPCLock-In DPC
    Bit rate88.2 Gbit/s1.26 Gbit/s
    Recording time for 8 GB memory0.72 s50.79 s
    Recording time for 16 GB memory1.45 s101.58 s
    Table 1. Example of Bit Rate and Recording Time at 1400 Frames per Second
    Chiara Bonati, Damien Loterie, Timothé Laforest, Christophe Moser. Lock-in incoherent differential phase contrast imaging[J]. Photonics Research, 2022, 10(1): 237
    Download Citation