
Yi-Chen Liu, Dong-Jie Guo, Ran Yang, Chang-Wei Sun, Jia-Chen Duan, Yan-Xiao Gong, Zhenda Xie, Shi-Ning Zhu, "Narrowband photonic quantum entanglement with counterpropagating domain engineering," Photonics Res. 9, 1998 (2021)
- Photonics Research
- Vol. 9, Issue 10, 1998 (2021)
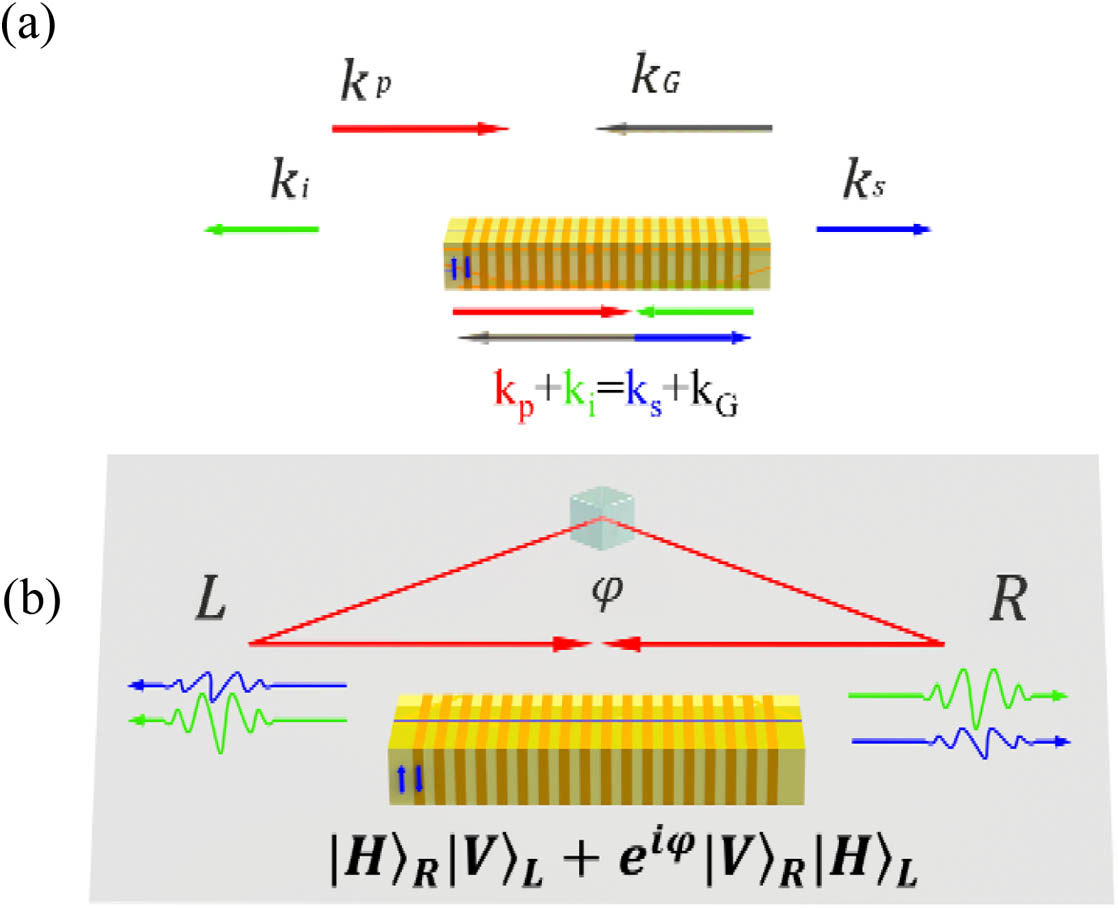
Fig. 1. Scheme of the counterpropagating polarization-entangled photon source. (a) Phase-matching diagram of the BSPDC; (b) polarization entanglement generation from the BSPDC with bidirectional pump light.
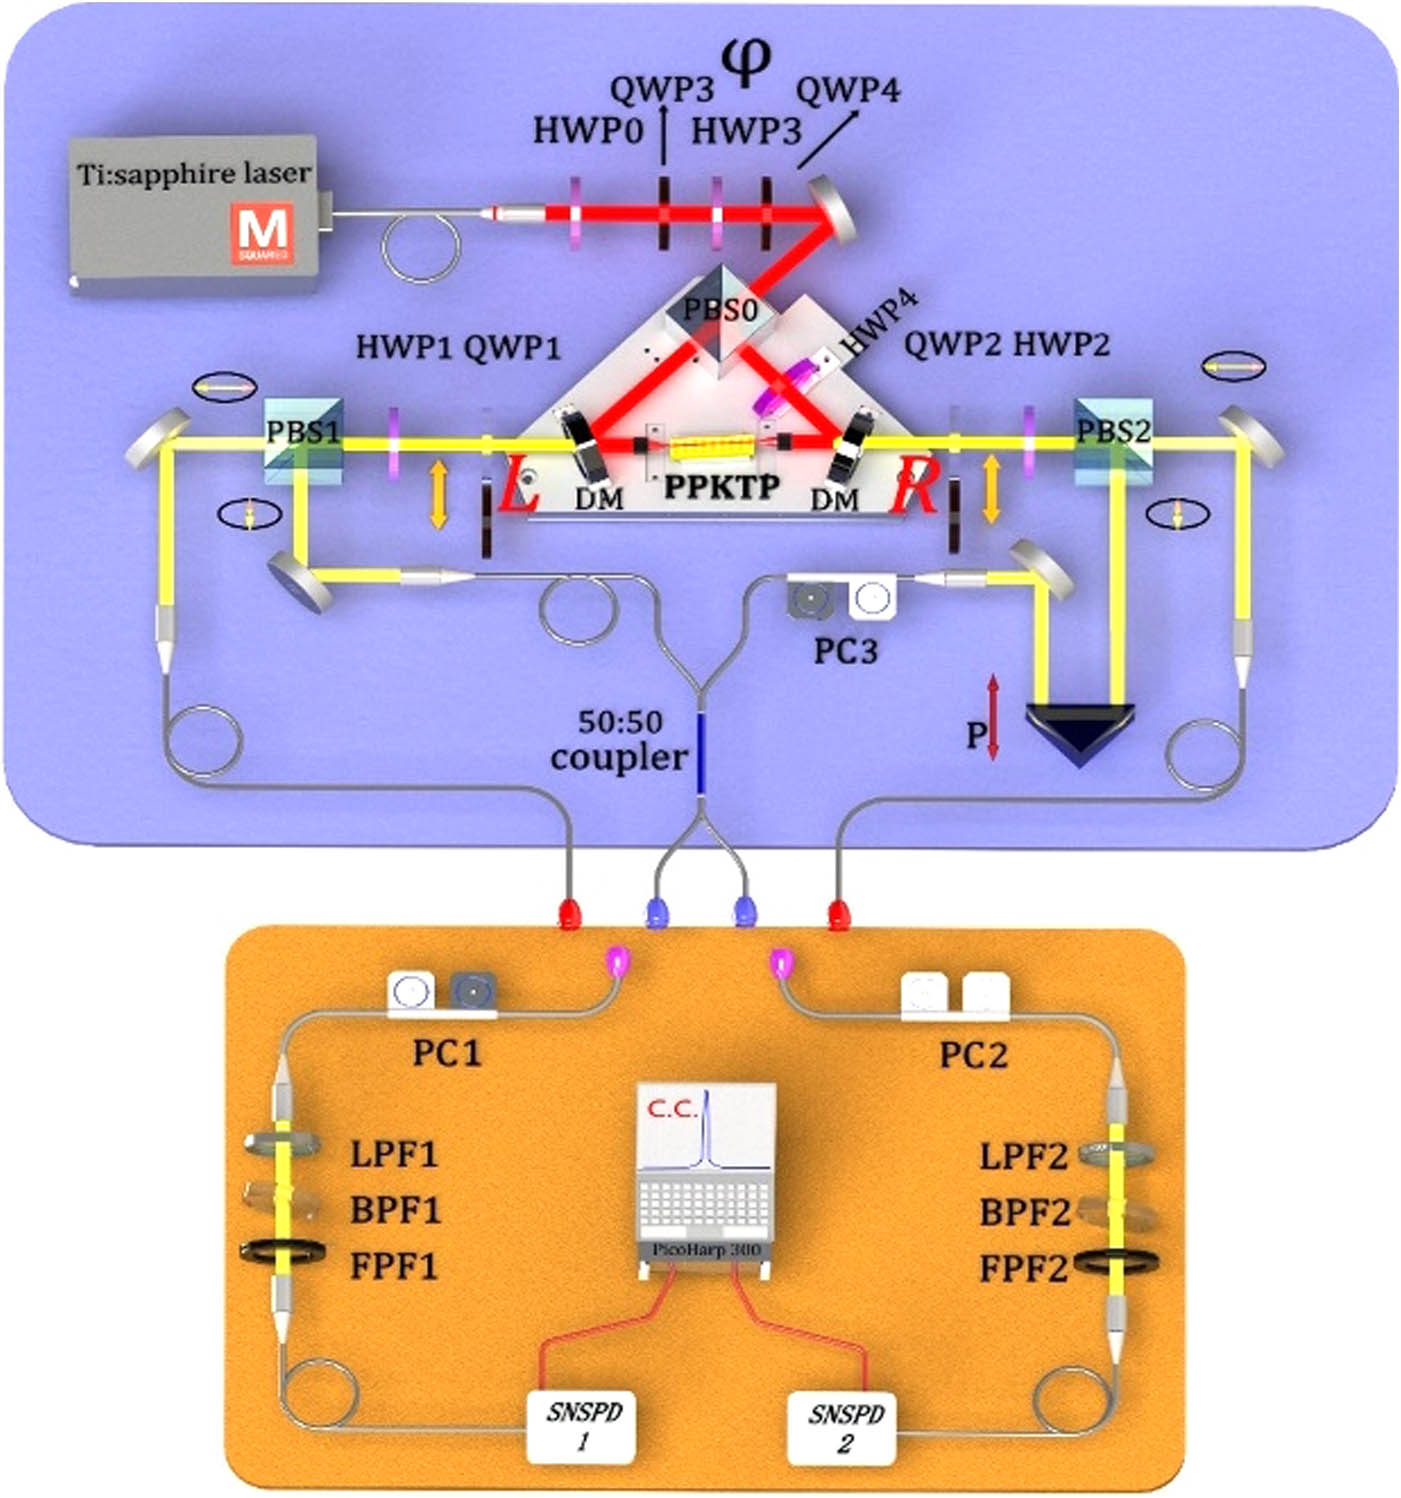
Fig. 2. Experimental setup. HWP, half-wave plate; QWP, quarter-wave plate; PBS, polarization beam splitter; DM, dichroic mirror; PC, polarization controller; LPF, long-pass filter; BPF, bandpass filter; FPF, Fabry–Perot filter; P, prism; SNSPD, superconducting nanowire single-photon detector; C.C., coincidence counts.
Fig. 3. SHG measurement. SHG output power as a function of FL wavelength. The red curve is a sinc 2
Fig. 4. BSPDC measurements. (a) Measurement of BSPDC spectrum. Black and red dots correspond to signal and idler photon spectra, respectively. The curve is fitted to sinc 2
Fig. 5. Entanglement correlation measurement. Coincidence counts are recorded as a function of HWP1 angle for changing the linear polarization projection measurement on one photon with the other photon projected to four states: H (blue), V (pink), D (red), and A (black), respectively. The curves are fitted with sine and cosine functions.
Fig. 6. (a) Real and (b) imaginary parts of the reconstructed density matrix for the produced polarization entanglement state.
Fig. 7. Phase stability test. Coincidence counts for | D D ⟩ | D A ⟩ | D D ⟩
Fig. 8. Characterization of the two Fabry–Perot resonators. (a) AFM image of FPC before and after coating; (b) Fabry–Perot resonator test setup. TSL, tunable semiconductor laser; PC, polarization controller; TC, temperature controller; FPC, Fabry–Perot cavity; FBS, fiber beam splitter; PD, photodetector. (c) FPC transmission intensity as a function of wavelength detuning from the center transmission peak. The upper inset shows the zoom-in of one transmission peak of 7.8 pm linewidth, and the lower inset is the measured temperature-wavelength relationship. (d) Transmission measurements for the FPF, with 6.17 nm FSR and 132 pm linewidth for the transmission peak.
|
Table 1. List of Narrowband Polarization-Entangled Photon Sources


Set citation alerts for the article
Please enter your email address

© Copyright 2018-2021 | Chinese Laser Press. All Rights Reserved 沪ICP备15018463号-20