• Photonics Research
  • Vol. 8, Issue 9, 1441 (2020)
Han Cui1、2、†, Yun Wang1、†, Lirong Qiu1、†, Shucheng Li1, Jonathan M. Cooper2, and Weiqian Zhao1、*
Author Affiliations
  • 1Key Laboratory for Precision Optoelectronic Measurement Instrument and Technology, School of Optics and Photonics, Beijing Institute of Technology, Beijing 100081, China
  • 2Division of Biomedical Engineering, James Watt School of Engineering, University of Glasgow, Glasgow G12 8LT, UK
  • show less
    DOI: 10.1364/PRJ.394537 Cite this Article Set citation alerts
    Han Cui, Yun Wang, Lirong Qiu, Shucheng Li, Jonathan M. Cooper, Weiqian Zhao. Synchronous nanoscale topographic and chemical mapping by differential-confocal controlled Raman microscopy[J]. Photonics Research, 2020, 8(9): 1441 Copy Citation Text show less
    Laser beam focus. (a) The laser beam is focussed at O. (b) Cross section of the beam at positions A, A′ and B, B′ away from the focus; (c) confocal axial response curve for a conventional CRM, where R is the position of maximum intensity, corresponding to the focus position O; (d) confocal axial response curve for a confocal microscope, where, again, M is the maximum position of the curve corresponding to the focus O; (e) differential confocal axial response curve, where the zero-crossing position Z, of the curve corresponds to the focus O. In (c)–(e), u is the normalized axial coordinate and I is the axial response intensity. RC, response curve.
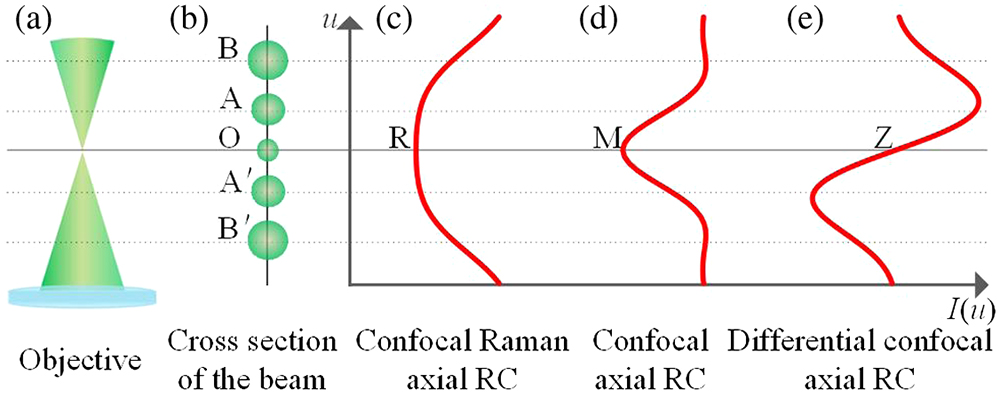
    Fig. 1. Laser beam focus. (a) The laser beam is focussed at O. (b) Cross section of the beam at positions A, A and B, B away from the focus; (c) confocal axial response curve for a conventional CRM, where R is the position of maximum intensity, corresponding to the focus position O; (d) confocal axial response curve for a confocal microscope, where, again, M is the maximum position of the curve corresponding to the focus O; (e) differential confocal axial response curve, where the zero-crossing position Z, of the curve corresponds to the focus O. In (c)–(e), u is the normalized axial coordinate and I is the axial response intensity. RC, response curve.
    Differential-confocal controlled Raman microscopy. (a) Schematic of DCCRM where PH is the pinhole, NPBS (R/T: 2/8) and NPBSD (R/T: 5/5) are the nonpolarizing beam splitters, PL is the pinhole lens, and RL is the Raman lens. (b) The differential confocal sensing curve, where u is the normalized axial coordinate, illustrating the linear characteristic of the response of IS over the interval V.
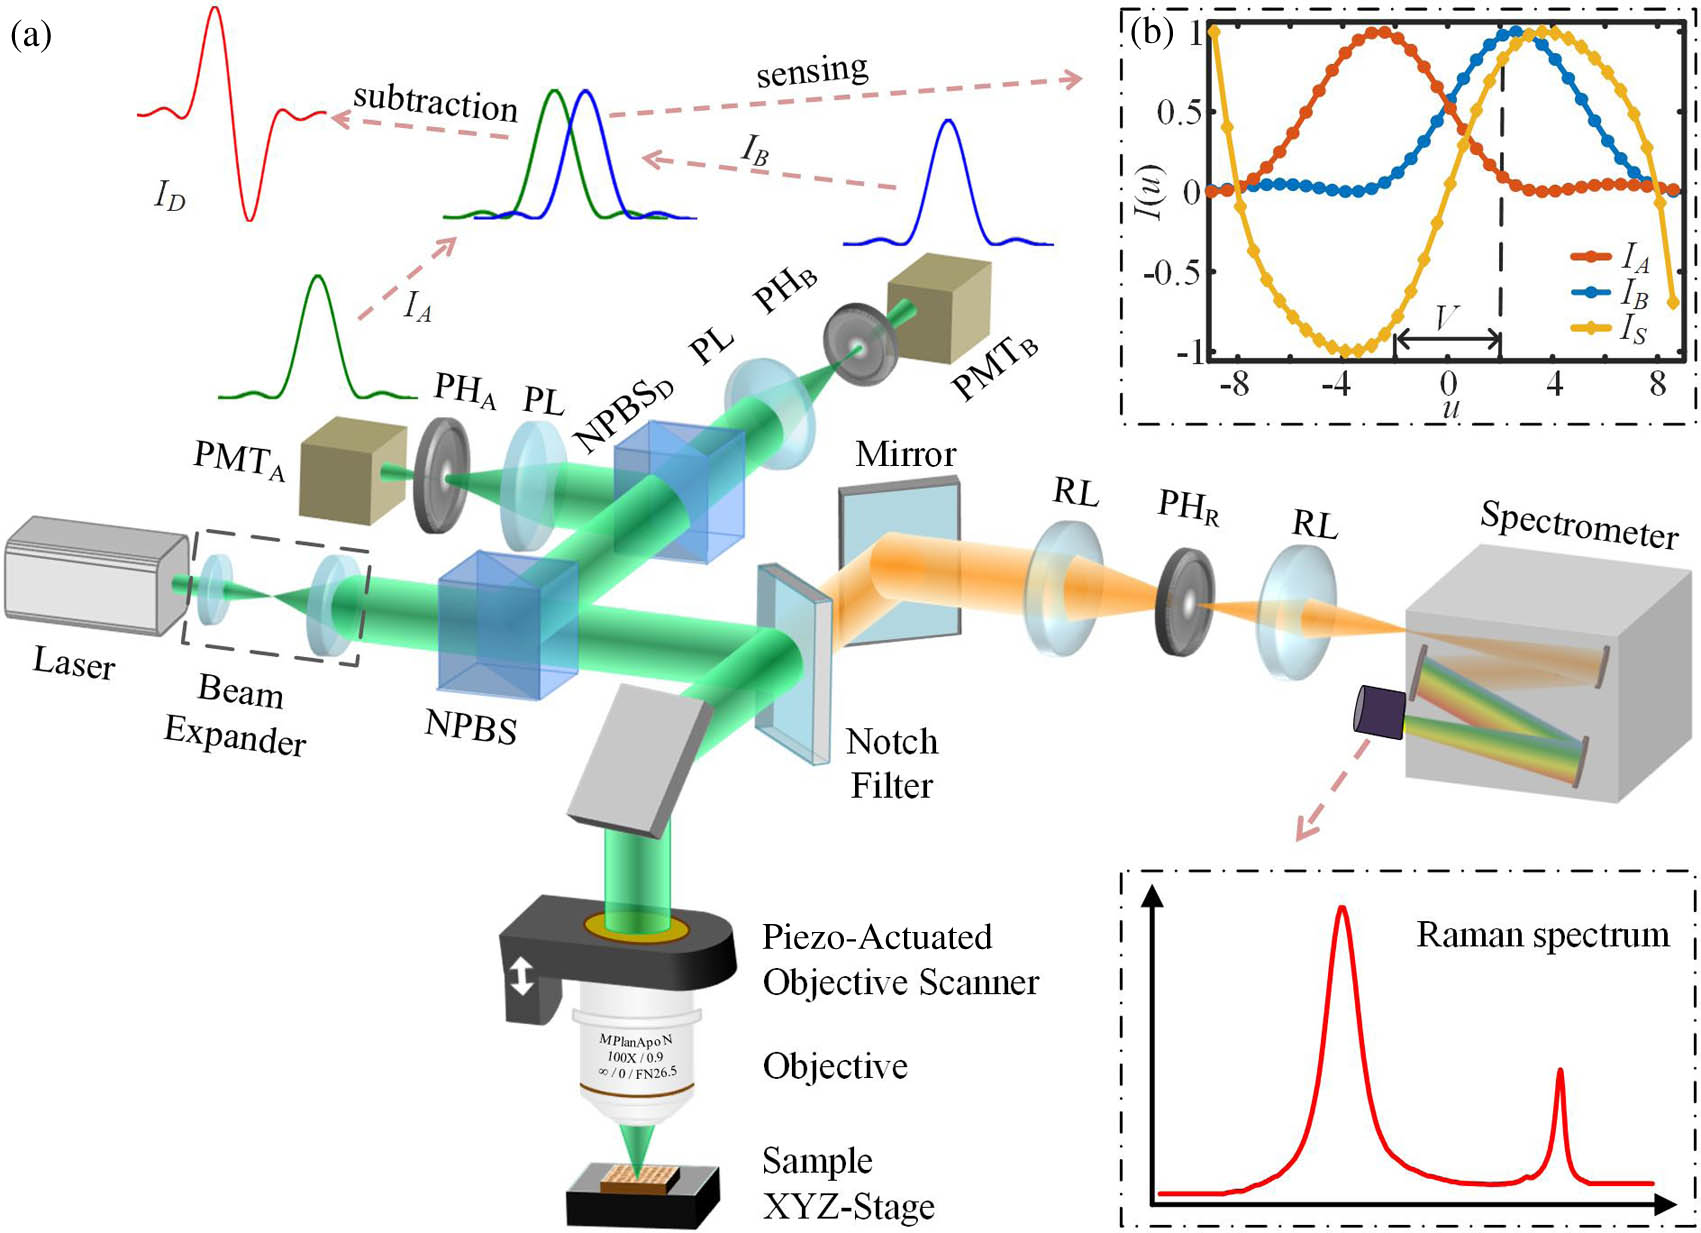
    Fig. 2. Differential-confocal controlled Raman microscopy. (a) Schematic of DCCRM where PH is the pinhole, NPBS (R/T: 2/8) and NPBSD (R/T: 5/5) are the nonpolarizing beam splitters, PL is the pinhole lens, and RL is the Raman lens. (b) The differential confocal sensing curve, where u is the normalized axial coordinate, illustrating the linear characteristic of the response of IS over the interval V.
    Axial focusing resolution measurements. Result of axial focusing resolution measurement (a) in the differential confocal configuration and (b) in the confocal Raman configuration; (c) 3D profile of the standard grating. (d) Comparison of the cross-sectional profile obtained with DCCRM, with image restoration (SDCCRM) and with AFM of the standard grating in (c), in which the DCCRM profile was extracted from data marked by the red arrow in (c).
    Fig. 3. Axial focusing resolution measurements. Result of axial focusing resolution measurement (a) in the differential confocal configuration and (b) in the confocal Raman configuration; (c) 3D profile of the standard grating. (d) Comparison of the cross-sectional profile obtained with DCCRM, with image restoration (SDCCRM) and with AFM of the standard grating in (c), in which the DCCRM profile was extracted from data marked by the red arrow in (c).
    Antidrift measurements using our custom-made grating sample to perform Raman scanning in CRM and DCCRM modes. (a) Antidrift measurement in CRM mode, measured as the normalized Raman intensity with a Z step of 3 μm at point A. There is a ∼70% fall in the normalized Raman intensity due to an abrupt sample defocusing event; (b) complementary results showing antidrift measurement in DCCRM mode. The same step in the Z stage occurred at position B, although there was no defocusing with no consequent decrease in the normalized Raman intensity. During the experiments, the Z stage was stepped at points A and B. The scanning sizes were 25.6 μm×6.4 μm, and the x, y scanning step was 400 nm. Note: Raman intensity is normalized.
    Fig. 4. Antidrift measurements using our custom-made grating sample to perform Raman scanning in CRM and DCCRM modes. (a) Antidrift measurement in CRM mode, measured as the normalized Raman intensity with a Z step of 3 μm at point A. There is a 70% fall in the normalized Raman intensity due to an abrupt sample defocusing event; (b) complementary results showing antidrift measurement in DCCRM mode. The same step in the Z stage occurred at position B, although there was no defocusing with no consequent decrease in the normalized Raman intensity. During the experiments, the Z stage was stepped at points A and B. The scanning sizes were 25.6  μm×6.4  μm, and the x, y scanning step was 400 nm. Note: Raman intensity is normalized.
    Topographic imaging and Raman mapping of the DCCRM system. (a) Photographic microscopic image; (b) topographic image; (c) single Raman spectrum; (d) distribution of material composition map; (e) shift of the Raman peak map; and (f) a topographic image (in x, y, z) and Raman map (in colors) merged. The x, y scanning range is 9.6 μm×9.6 μm, with a scanning step of 150 nm.
    Fig. 5. Topographic imaging and Raman mapping of the DCCRM system. (a) Photographic microscopic image; (b) topographic image; (c) single Raman spectrum; (d) distribution of material composition map; (e) shift of the Raman peak map; and (f) a topographic image (in x, y, z) and Raman map (in colors) merged. The x, y scanning range is 9.6  μm×9.6  μm, with a scanning step of 150 nm.
    Han Cui, Yun Wang, Lirong Qiu, Shucheng Li, Jonathan M. Cooper, Weiqian Zhao. Synchronous nanoscale topographic and chemical mapping by differential-confocal controlled Raman microscopy[J]. Photonics Research, 2020, 8(9): 1441
    Download Citation