• Laser & Optoelectronics Progress
  • Vol. 59, Issue 3, 0314004 (2022)
Rusong Li1、2 and Huanyu Lu1、*
Author Affiliations
  • 1State Key Laboratory of Luminescence and Applications, Changchun Institute of Optics, Fine Mechanics and Physics, Chinese Academy of Sciences, Changchun , Jilin 130033, China
  • 2Center of Materials Science and Optoelectronics Engineering, University of Chinese Academy of Sciences, Beijing 100049, China
  • show less
    DOI: 10.3788/LOP202259.0314004 Cite this Article Set citation alerts
    Rusong Li, Huanyu Lu. Research on Threshold Gain and Output Optical Power of Photonic Crystal Surface Emitting Lasers[J]. Laser & Optoelectronics Progress, 2022, 59(3): 0314004 Copy Citation Text show less
    Energy band diagram of two-dimensional square-lattice photonic crystal slab structure
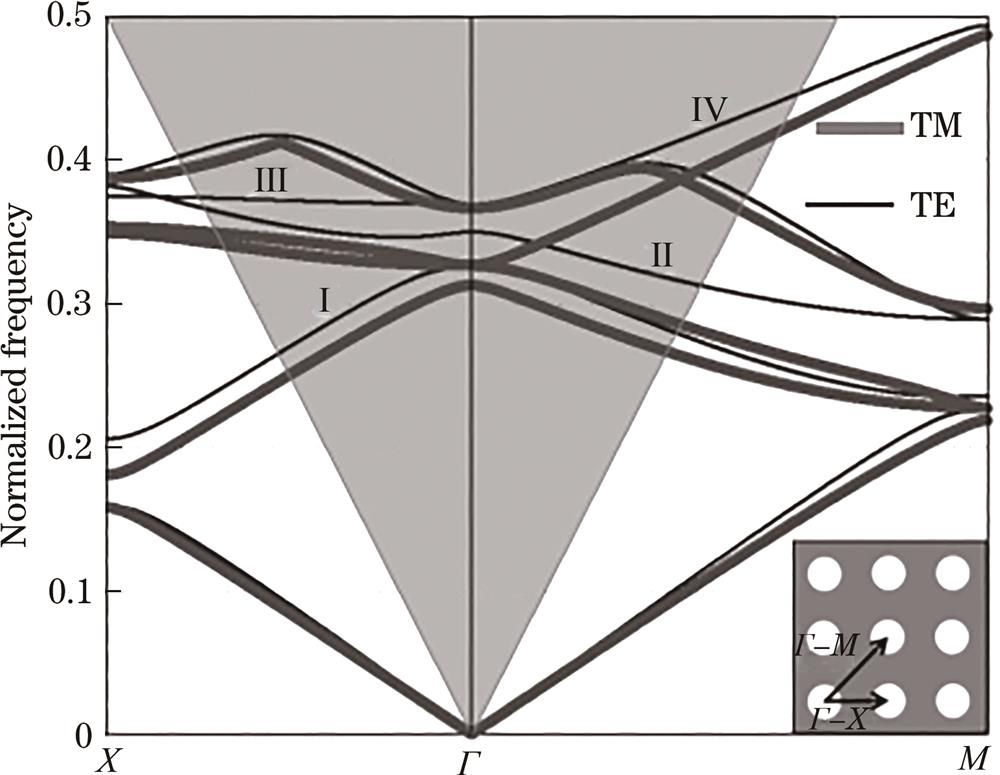
    Fig. 1. Energy band diagram of two-dimensional square-lattice photonic crystal slab structure
    Schematic diagram of Bragg diffraction conditions. (a) Bragg diffraction conditions of point X; (b) Bragg diffraction conditions of point M; (c) Bragg diffraction conditions of point Γ2 (in-plane); (d) Bragg diffraction conditions of point Γ2 (out-of-plane)
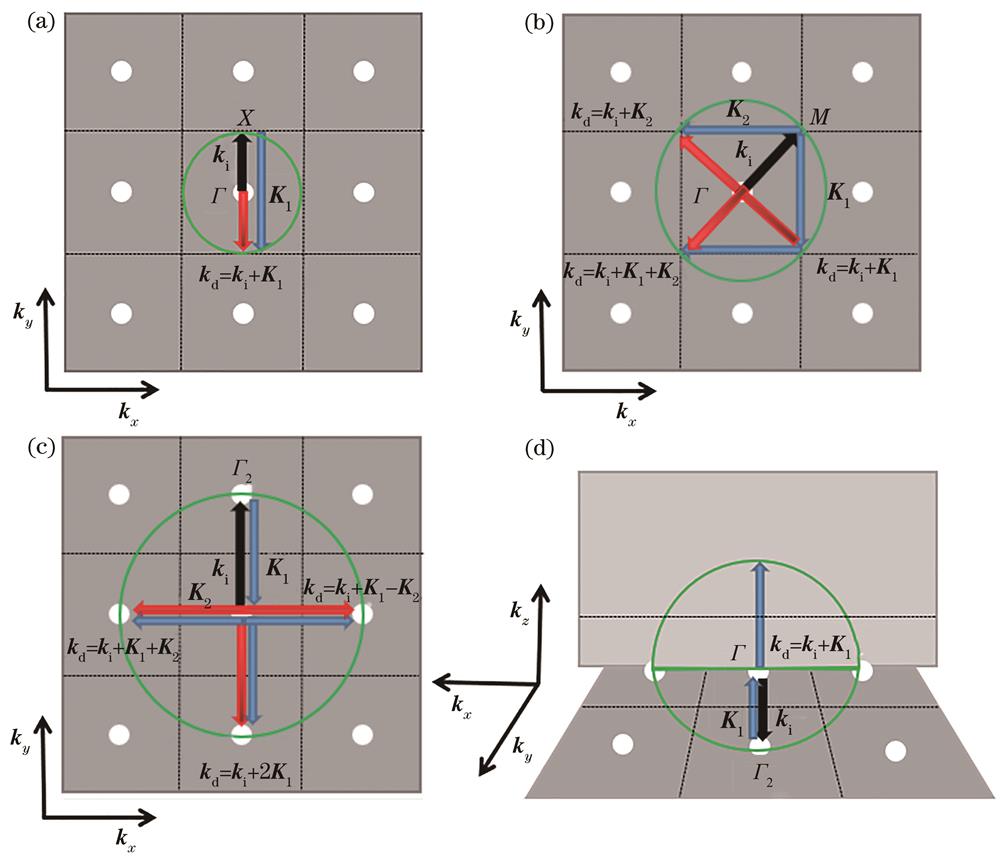
    Fig. 2. Schematic diagram of Bragg diffraction conditions. (a) Bragg diffraction conditions of point X; (b) Bragg diffraction conditions of point M; (c) Bragg diffraction conditions of point Γ2 (in-plane); (d) Bragg diffraction conditions of point Γ2 (out-of-plane)
    Schematic diagram of the diffraction of the photonic crystal plane. (a) In-plane diffraction; (b) out-of-plane diffraction
    Fig. 3. Schematic diagram of the diffraction of the photonic crystal plane. (a) In-plane diffraction; (b) out-of-plane diffraction
    Schematic diagram of PCSELs resonant cavity loss
    Fig. 4. Schematic diagram of PCSELs resonant cavity loss
    Change curves of carrier density and photon density with time. (a) Change curve of carrier density with time; (b) change curve of photon density with time
    Fig. 5. Change curves of carrier density and photon density with time. (a) Change curve of carrier density with time; (b) change curve of photon density with time
    Relationship between optical power and injection current in steady state
    Fig. 6. Relationship between optical power and injection current in steady state
    TE modeΓ2-1Γ2-4Γ2-2
    Q163106101
    Table 1. Q values of four TE modes[22]
    Rusong Li, Huanyu Lu. Research on Threshold Gain and Output Optical Power of Photonic Crystal Surface Emitting Lasers[J]. Laser & Optoelectronics Progress, 2022, 59(3): 0314004
    Download Citation