• Photonics Research
  • Vol. 10, Issue 1, 155 (2022)
Bega Karadza1, Hannes Van Avermaet2, Leila Mingabudinova2, Zeger Hens2, and Youri Meuret1、*
Author Affiliations
  • 1KU Leuven, Department of Electrical Engineering (ESAT), Light & Lighting Laboratory, Gebroeders De Smetstraat 1, 9000 Gent, Belgium
  • 2Physics and Chemistry of Nanostructures and Center for Nano and Biophotonics, Krijgslaan 281-S3, 9000 Gent, Belgium
  • show less
    DOI: 10.1364/PRJ.428843 Cite this Article Set citation alerts
    Bega Karadza, Hannes Van Avermaet, Leila Mingabudinova, Zeger Hens, Youri Meuret. Efficient, high-CRI white LEDs by combining traditional phosphors with cadmium-free InP/ZnSe red quantum dots[J]. Photonics Research, 2022, 10(1): 155 Copy Citation Text show less
    Blackbody spectrum for CCT of 4000 K that is cropped by the blue LED spectrum on the left side, and the red quantum dot spectrum (represented by a Gaussian distribution) on the right side.
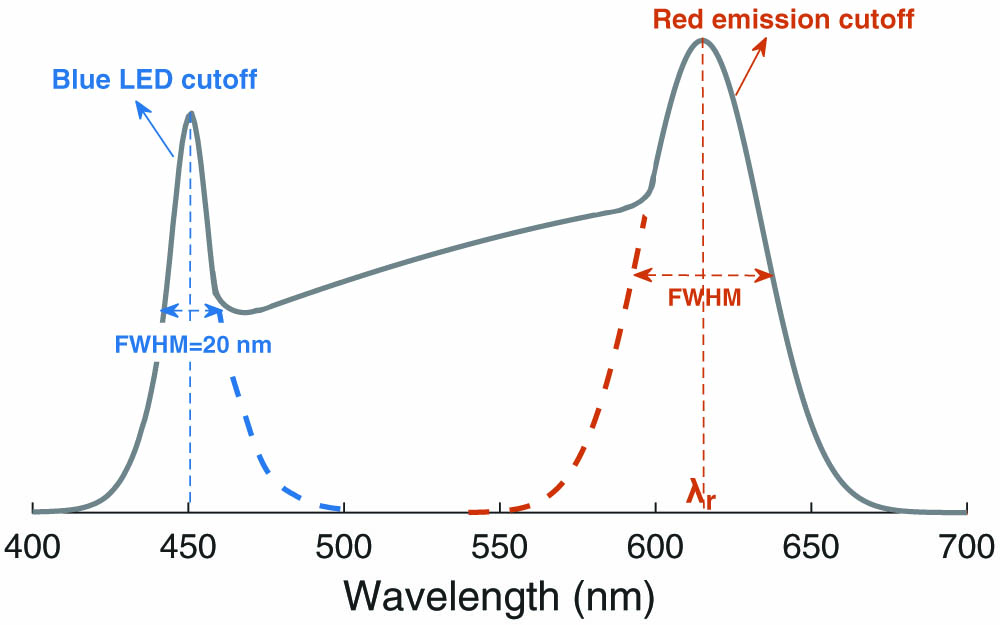
    Fig. 1. Blackbody spectrum for CCT of 4000 K that is cropped by the blue LED spectrum on the left side, and the red quantum dot spectrum (represented by a Gaussian distribution) on the right side.
    (a) Image of the “empty” LUXEON 3535 LED module. (b) Simulation model of the LED package: 1, LED chip; 2, bottom reflector; 3, inner side of recycling cavity; 4, diffusing bar; 5, package. (c) Reflectance of the LED package and blue chip.
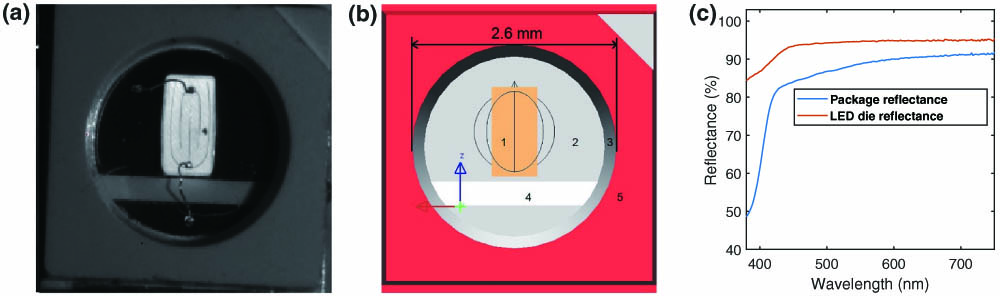
    Fig. 2. (a) Image of the “empty” LUXEON 3535 LED module. (b) Simulation model of the LED package: 1, LED chip; 2, bottom reflector; 3, inner side of recycling cavity; 4, diffusing bar; 5, package. (c) Reflectance of the LED package and blue chip.
    (a) Simulated and measured spectral power distribution of resin samples with different phosphor loadings: Sample 1 (1 mL resin+0.32 g YAG:Ce), Sample 2 (1 mL resin+0.082 g YAG:Ce), and Sample 3 (1 mL resin+0.025 g YAG:Ce). (b) Simulated/measured spectra of LED coated with 1 mL resin mixed with 0.048 g YAG:Ce. (c) Simulated/measured radiation pattern of LED package filled with clear resin.
    Fig. 3. (a) Simulated and measured spectral power distribution of resin samples with different phosphor loadings: Sample 1 (1  mLresin+0.32g YAG:Ce), Sample 2 (1  mLresin+0.082g YAG:Ce), and Sample 3 (1  mLresin+0.025g YAG:Ce). (b) Simulated/measured spectra of LED coated with 1 mL resin mixed with 0.048 g YAG:Ce. (c) Simulated/measured radiation pattern of LED package filled with clear resin.
    Emission/absorption spectrum of YAG:Ce (545 nm), LuAG:Ce (516 nm), and red InP/ZnSe quantum dots.
    Fig. 4. Emission/absorption spectrum of YAG:Ce (545 nm), LuAG:Ce (516 nm), and red InP/ZnSe quantum dots.
    (a) Ra, (b) R9, and (c) LE values of the cropped backbody spectrum (CCT=4000 K) for different red peak wavelengths and FWHM. The purple isocurve connects the points where Ra has a value of 93, and the R9 values on the curve are approximately 50, while LE changes but only slightly. As an example, the three points in panel (c) indicate the exact values of LE for three different FWHMs; one can notice that red QDs with more narrow FWHM must emit at longer wavelengths to achieve the same Ra/R9 values. As a result, differences in LE values are limited. Graph (d) shows the dependence of LE on FWHM, for the case when Ra is 93.
    Fig. 5. (a) Ra, (b) R9, and (c) LE values of the cropped backbody spectrum (CCT=4000K) for different red peak wavelengths and FWHM. The purple isocurve connects the points where Ra has a value of 93, and the R9 values on the curve are approximately 50, while LE changes but only slightly. As an example, the three points in panel (c) indicate the exact values of LE for three different FWHMs; one can notice that red QDs with more narrow FWHM must emit at longer wavelengths to achieve the same Ra/R9 values. As a result, differences in LE values are limited. Graph (d) shows the dependence of LE on FWHM, for the case when Ra is 93.
    LED1, measured spectral power distribution of the white QD-LED with Ra=80. This white LED has a CCT ≈ 4100 K and an LE of 143 lm/W.
    Fig. 6. LED1, measured spectral power distribution of the white QD-LED with Ra=80. This white LED has a CCT 4100  K and an LE of 143 lm/W.
    LED2, white QD-LED with the cyan region perfectly filled by using the LuAG:Ce phosphor, resulting in Ra>90 (CCT ≈4200 K, x=0.3755, y=0.3888). LED3, measured spectral power distribution of the white LED using LuAG:Ce (516 nm) and red-emitting QDs (611 nm). It has both high Ra=94 and R9=84 (CCT ≈4400 K, x=0.3618, y=0.3557).
    Fig. 7. LED2, white QD-LED with the cyan region perfectly filled by using the LuAG:Ce phosphor, resulting in Ra>90 (CCT 4200  K, x=0.3755, y=0.3888). LED3, measured spectral power distribution of the white LED using LuAG:Ce (516 nm) and red-emitting QDs (611 nm). It has both high Ra=94 and R9=84 (CCT 4400  K, x=0.3618, y=0.3557).
    LED4, measured spectral power distribution of the white LED using LuAG:Ce (516 nm), YAG:Ce (545 nm), and red-emitting QDs (611 nm) as luminescent materials. This LED balances color rendering and LE performance.
    Fig. 8. LED4, measured spectral power distribution of the white LED using LuAG:Ce (516 nm), YAG:Ce (545 nm), and red-emitting QDs (611 nm) as luminescent materials. This LED balances color rendering and LE performance.
    Spectra of different white LEDs with similar color rendering performance (Ra=90/R9≈50) for CCT=3000 K and 4000 K. The white LEDs with red-emitting nitride-based phosphor induce clearly much more lumen loss compared to the QD-based LEDs due to the broad red tail that extends far beyond the human eye sensitivity curve.
    Fig. 9. Spectra of different white LEDs with similar color rendering performance (Ra=90/R950) for CCT=3000K and 4000 K. The white LEDs with red-emitting nitride-based phosphor induce clearly much more lumen loss compared to the QD-based LEDs due to the broad red tail that extends far beyond the human eye sensitivity curve.
    (a) Measured spectral power distribution of the demonstrated InP/ZnSe QD-LED4 (CCT=4000 K, LE=132 lm/W) and corresponding simulated spectrum. (b) Pie chart of the various power losses in the demonstrated QD-LED4. The different loss mechanisms were estimated with the developed simulation model in LightTools.
    Fig. 10. (a) Measured spectral power distribution of the demonstrated InP/ZnSe QD-LED4 (CCT=4000K, LE=132 lm/W) and corresponding simulated spectrum. (b) Pie chart of the various power losses in the demonstrated QD-LED4. The different loss mechanisms were estimated with the developed simulation model in LightTools.
    Predicted luminous efficacy values of the InP/ZnSe QD-LED with CCT = 4000 K for (a) varying wall-plug efficiency of the blue LED chip and (b) varying quantum yield of the InP/ZnSe quantum dots.
    Fig. 11. Predicted luminous efficacy values of the InP/ZnSe QD-LED with CCT = 4000 K for (a) varying wall-plug efficiency of the blue LED chip and (b) varying quantum yield of the InP/ZnSe quantum dots.
     InP/ZnSe QDsYAG:Ce (545 nm)LuAG:Ce (516 nm)
    μs (at 450 nm) [mm-1]03.51.95
    μa (at 450 nm) [mm-1]0.440.720.33
    PLQY [%]75–809892
    Table 1. Scattering/Absorption Coefficient and PLQY of Fluorescent Materials
    LED TypeLER (lm/W)Compared to InP QDs
    3000K nitride phosp. [6]274−17%
    3000K Cd-based QDs [6]340+4.5%
    3000K InP/ZnSe QDs325
    4000K nitride phosp. [45]285−18.2%
    4000K Cd-based QDs [44]314−8.4%
    4000K InP/ZnSe QDs345
    Table 2. Luminous Efficacy of Radiation of White LEDs with Different Luminescent Materials for the Red Emission
    Bega Karadza, Hannes Van Avermaet, Leila Mingabudinova, Zeger Hens, Youri Meuret. Efficient, high-CRI white LEDs by combining traditional phosphors with cadmium-free InP/ZnSe red quantum dots[J]. Photonics Research, 2022, 10(1): 155
    Download Citation