• Photonics Research
  • Vol. 10, Issue 1, 155 (2022)
Bega Karadza1, Hannes Van Avermaet2, Leila Mingabudinova2, Zeger Hens2, and Youri Meuret1、*
Author Affiliations
  • 1KU Leuven, Department of Electrical Engineering (ESAT), Light & Lighting Laboratory, Gebroeders De Smetstraat 1, 9000 Gent, Belgium
  • 2Physics and Chemistry of Nanostructures and Center for Nano and Biophotonics, Krijgslaan 281-S3, 9000 Gent, Belgium
  • show less
    DOI: 10.1364/PRJ.428843 Cite this Article Set citation alerts
    Bega Karadza, Hannes Van Avermaet, Leila Mingabudinova, Zeger Hens, Youri Meuret. Efficient, high-CRI white LEDs by combining traditional phosphors with cadmium-free InP/ZnSe red quantum dots[J]. Photonics Research, 2022, 10(1): 155 Copy Citation Text show less

    Abstract

    Quantum dots (QDs) offer an interesting alternative for traditional phosphors in on-chip light-emitting diode (LED) configurations. Earlier studies showed that the spectral efficiency of white LEDs with high color rendering index (CRI) values could be considerably improved by replacing red-emitting nitride phosphors with narrowband QDs. However, the red QDs in these studies were cadmium-based, which is a restricted element in the EU and certain other countries. The use of InP-based QDs, the most promising Cd-free alternative, is often presented as an inferior solution because of the broader linewidth of these QDs. However, while narrow emission lines are the key to display applications that require a large color gamut, the spectral efficiency penalty of this broader emission is limited for lighting applications. Here, we report efficient, high-CRI white LEDs with an on-chip color converter coating based on red InP/ZnSe QDs and traditional green/yellow powder phosphors. Using InP/ZnSe QDs with a quantum yield of nearly 80% and a full width at half-maximum of 45 nm, we demonstrate high spectral efficiency for white LEDs with very high CRI values. One of the best experimental results in terms of both luminous efficacy and color rendering performance is a white LED with an efficacy of 132 lm/W, and color rendering indices of Ra90, R950 for CCT 4000 K. These experimental results are critically compared with theoretical benchmark values for white LEDs with on-chip downconversion from both phosphors and red Cd-based QDs. The various loss mechanisms in the investigated white LEDs are quantified with an accurate simulation model, and the main impediments to an even higher efficacy are identified as the blue LED wall-plug efficiency and light recycling in the LED package.

    1. INTRODUCTION

    The performance of phosphor-converted white light-emitting diode (LED) technology rises steadily toward its physical limits. Luminous efficacy (LE) has almost doubled in the last 10 years, but the achieved values are still considerably lower than the theoretically calculated maxima [1]. Further improvements are possible by increasing blue chip and package efficiency, as well as the spectral efficiency by developing fluorescent materials with optimal optical characteristics and a high photoluminescence quantum yield (PLQY).

    Efficiency, however, is not the only property that determines the quality of a white LED. The ability to reproduce colors faithfully in comparison with an ideal or natural light source is a second, very important characteristic. The International Commission on Illumination (CIE) has defined an internationally agreed method to quantify the ability of a light source to render color [2]. Their most widely used metric (CIE Ra) is based on the shift of the chromaticity coordinates of predefined test color samples (TCSs) when illuminated by the light source in comparison to illumination with a reference light source. This reference light source is a blackbody emitter when the light source has a correlated color temperature (CCT) below 5000 K. A maximum value of 100 is obtained when there are no color differences for each TCS. A total of 14 TCSs are specified in the CIE 13.3-1995 report. While Ra is an average quantity that covers the first eight samples, R9 is an individual rendering index for the highly saturated red TCS2 [3]. This R9 value is often added to the Ra value in order to have a more complete description of the color rendering performance. While other color rendering metrics have appeared in recent years, the CIE Ra metric is still the industry standard [3]. The California Energy Commission (CEC) standard recommends a color rendering index (CRI, the CIE Ra value) of at least 90 and an R9 value of at least 50 [4], requirements we refer to as Ra 90, R9 50. This recommendation matches with the general customer preferences for color fidelity [5,6]. Although the Ra 90, R9 50 requirements were enacted back in 2013, their adoption by industry takes time due to the significant efficiency penalty that relates to the transition from Ra 80 to Ra 90 [6]. This penalty is mainly caused by the broad emission of the red nitride phosphors that are typically used in white LEDs. These phosphors have an emission band that extends deep into the red region of the visible spectrum, where the reduced sensitivity of the human eye leads to a strongly diminished LE. For this reason, there is a strong interest in red-emitting narrowband phosphors. One of the most promising phosphors in that respect is K2SiF6:Mn4+, with an emission spectrum that consists of five very narrow peaks in the 629–634 nm range, and a relative high quantum efficiency that can go up to 90% or more. The downside of this phosphor, however, v is the relative slow decay of the excited states, causing optical quenching at higher input powers (starting at a few tens of W/cm2) [7].

    Quantum dots (QDs) are often presented in the literature as another alternative for the conventional red nitride phosphors. A main advantage of QDs is their very short decay time [8], which offers high power saturation in the range of 104  W/cm2 [9]. Other advantages of QDs are their narrow and size-dependent emission spectrum, potentially high, near unity quantum efficiency, and tiny particle size in the range of a few nanometers [10,11]. Estrada et al. [6] stated that with traditional inorganic phosphors as downconversion materials, the transition from Ra 80 to Ra 90 results in a lumen loss of 17% for a CCT of 2700 K. However, replacing red-emitting nitride phosphors with more narrowband red-emitting QDs should reduce this efficiency drop to merely 6% on a normalized lm/W basis. Such small differences are really advocating the adoption of CRI-Ra 90. To prove this point, Estrada et al. made use of Cd-based QDs with a PLQY in the range of 80%–90% [6,12,13], a spectrally narrow emission with a full width at half-maximum (FWHM) of 36 nm, and a minor overlap between the absorption and emission spectra. In 2019, OSRAM launched the first stable QD-based white LED on the market, which offers a 0.2 W output with an efficacy value of 173 lm/W at 3000 K and an Ra of 90. To the best of our knowledge, this LED also uses Cd-based QDs [14]. Cadmium, however, is a restricted element in the EU under the RoHS directive (Restriction of Hazardous Substances in electrical and electronic equipment) [13]. Similar directives have been adopted by other regulators in, for example, Japan, South Korea [15], and California [16].

    A promising cadmium-free alternative is InP-based QDs. The possibility to use such QDs as color converters for white LEDs was already shown in the literature [17,18]. While providing a proof-of-concept, the resulting QD-LEDs had low efficacy and did not reach the Ra/R9 color rendering standard. More in general, the implementation of alternatives to Cd-based QDs has often been questioned because of the wider emission spectrum and lower PLQY of such materials as compared to Cd-based QDs [13,19,20].

    In this paper, we demonstrate that InP/ZnSe QDs with an emission line 45  nm wide and a PLQY of 80% are a viable alternative for making efficient, high-CRI white LEDs using on-chip color conversion. First, we evaluate the relation between the central emission wavelength and the linewidth on the maximal LE and color rendering of a QD-LED by means of a theoretical emission spectrum. We find that the efficiency gain that comes with a narrower QD emission line is partially offset by the redshift of that line needed to preserve color rendering. Importantly, this trade-off makes the need for narrow emission lines less stringent in the case of high-CRI white LEDs than for the LEDs that large-color gamut display applications need [2123]. Building on these theoretical estimates, we fabricate white QD-LEDs with on-chip color converters based on a mixture of red InP/ZnSe QDs with green powder phosphors. Focusing first on 4000 K spectra, we show that real QD-LEDs can indeed attain a color rendering performance in close agreement with current standards, i.e., Ra90, R950, by partially closing the cyan gap between the blue pump light and optimizing the central wavelength of red InP/ZnSe QDs. Next, we show that, both for 3000 K and 4000 K spectra, QD-LEDs using red InP/ZnSe QDs attain a better luminous efficacy of radiation (LER) than LEDs using red nitride phosphors and are comparable to QD-LEDs using red Cd-based QDs. Finally, we argue that the main loss mechanism leading to an LE of 132 lm/W at CCT=4000K for the best QD-LED is not the efficiency of the InP/ZnSe QDs but rather the wall-plug efficiency of the blue LED and the light recycling in the LED package. We, thus, conclude that InP-based QDs are the most promising red emitter for efficient, high-CRI white LEDs based on on-chip color conversion.

    2. METHODS

    A. Theoretical Benchmark for Color Rendering and Efficacy

    The LE is the ratio of the emitted luminous flux to the consumed electrical power. To investigate the maximal Ra/R9 and corresponding LE values that can be obtained by a phosphor-converted white LED that includes red-emitting QDs, we used a theoretical emission spectrum. This spectrum was constructed based on the following considerations. For any given CCT below 5000 K, maximal Ra/R9 values are obtained by the corresponding blackbody spectrum that is covering the full visible domain. However, to balance color rendering and LE, the emission spectrum of a practical phosphor-converted LED is typically cropped by the emission spectrum of the (blue) source LED at the short-wavelength side and the emission spectrum of the red-emitting phosphor at the long-wavelength side. As we used a single blue source LED with a maximum emission intensity at 450 nm and FWHM of 20 nm for all our experimental results, we cropped the blackbody spectrum at short wavelengths with this spectrum. At the long-wavelength side, on the other hand, we delimited the spectrum by a Gaussian line with an adjustable central wavelength λr and FWHM that represents the red emission of different QDs. Finally, we adjust the intensity of the blue LED and red QD band so as to keep the cropped blackbody spectrum at the desired CCT on the blackbody locus. Figure 1 shows an example of such a spectrum. The resulting spectrum provides a good trade-off between color rendering and LE and serves as a benchmark for our experimental results.

    Blackbody spectrum for CCT of 4000 K that is cropped by the blue LED spectrum on the left side, and the red quantum dot spectrum (represented by a Gaussian distribution) on the right side.

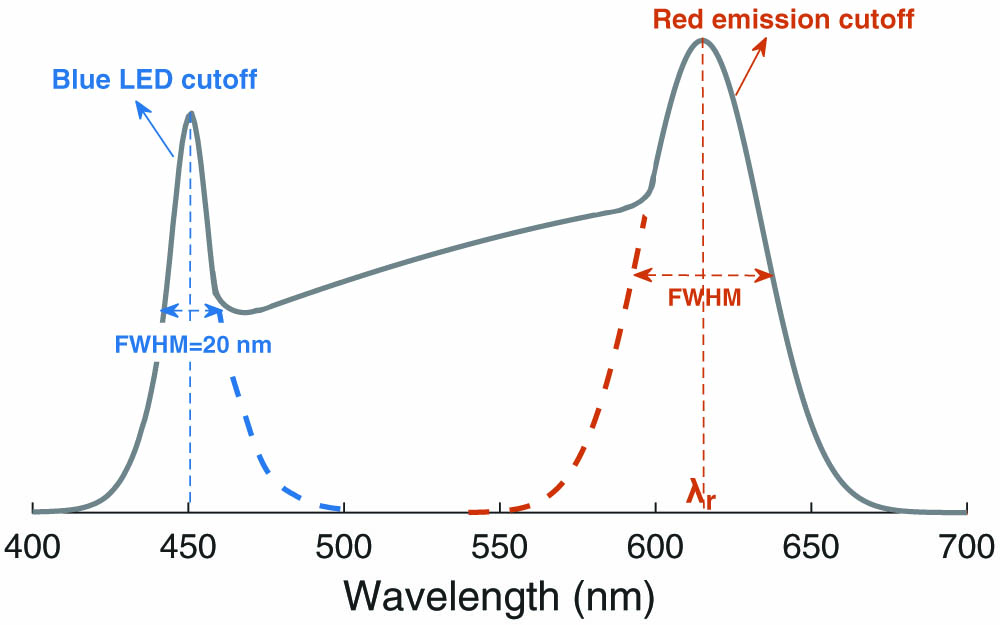
    Figure 1.Blackbody spectrum for CCT of 4000 K that is cropped by the blue LED spectrum on the left side, and the red quantum dot spectrum (represented by a Gaussian distribution) on the right side.

    The influence of the center wavelength (λr) and FWHM of the red QD emission band on the Ra, R9, and LE values was calculated using the Python LuxPy package [24]. For calculating the LE values, we assumed a lossless electrical to optical power conversion for the blue LED and we only considered Stokes losses for the QD color conversion. Hence, the resulting LE values correspond to theoretical maximum efficiencies for phosphor-converted white LEDs with red QDs as specified.

    B. Experimental Procedures

    1. Synthesis of Red-Emitting InP/ZnSe Core/Shell QDs

    2. Preparation of White LEDs

    We used LUXEON 3535 LED packages from Lumileds (see Fig. 2), without the phosphor in polymer on top of the blue LED chip. These blue LED chips had an emission peak at 450 nm and a wall-plug efficiency of around 70% (±3.5%) when operated with a forward current of 50 mA at room temperature. To create a white LED with a specific CCT, this chip was coated with a color-converter resin containing a mixture of traditional phosphors and red-emitting InP/ZnSe QDs. Inorganic phosphor powders [YAG:Ce (545 nm) and LuAG:Ce (516 nm)] were purchased from Intematix, while red InP/ZnSe QDs with FWHM=45±5  nm were synthesized by the protocol described above. The clear photopolymer resin from Formlabs [27] was used as binder material. This resin has a viscosity of 850–900 cps and a refractive index of 1.54 (at 650 nm) after curing. Phosphor-containing resins were made by loading the required mass of the inorganic phosphors and the uncured resin in a vial, and adding a predetermined volume of a QD-in-toluene dispersion. After the toluene had evaporated, the mixture was homogenized, deposited in the LED recycling cavity with a micropipette, and cured. During this process, the high viscosity and short curing time—a few minutes—helped prevent phosphor sedimentation. Moreover, the photo-initiator in the resin enables the mixture to be cured using wavelengths at around 420 nm, which is helpful since light absorption by the QDs can completely prevent UV curing at shorter wavelengths. The spectral radiant flux of the resulting LEDs was measured with a custom-made integrating sphere [28]. LEDs were operated with a drive current of 50 mA and a typical forward voltage of 2.76 V, resulting in a corresponding electrical input power of 0.138 W.

    (a) Image of the “empty” LUXEON 3535 LED module. (b) Simulation model of the LED package: 1, LED chip; 2, bottom reflector; 3, inner side of recycling cavity; 4, diffusing bar; 5, package. (c) Reflectance of the LED package and blue chip.

    Figure 2.(a) Image of the “empty” LUXEON 3535 LED module. (b) Simulation model of the LED package: 1, LED chip; 2, bottom reflector; 3, inner side of recycling cavity; 4, diffusing bar; 5, package. (c) Reflectance of the LED package and blue chip.

    C. Simulation Model of White LED Configuration

    Reliable simulations are required to quantify the various loss mechanisms in an LED package and make predictions of potential performance improvements with a more efficient LED chip or QDs with higher quantum yield. Furthermore, simulations enable us to predict the composition of the color-converter resin needed to obtain a specific emission spectrum, thereby avoiding time-consuming trial-and-error experiments.

    To be accurate, the simulation model of a white LED package with multiple luminescent materials must include all interactions—absorption, emission, scattering, and re-absorption—of the blue source light and the photoluminescence light, with the different luminescent materials and the LED package. We implemented such simulations in LightTools [29], a commercially available ray-tracing software package.

    The LED package and the simulation model, which includes the optical properties of the package and the blue LED chip, are shown in Fig. 2.

    As can be seen, the package contained a single 580μm×1143μm×200  μm blue LED chip. The diameter and depth of the LED cup were 2.6 mm and 0.5 mm, respectively. We measured the specular reflectance of the bottom reflector and LED die, as well as the diffuse reflectance of the LED package sidewalls. The results can be seen in Fig. 2(c) and coincide more or less with the typical values stated in the literature [30,31]. The blue LED chip was assumed to be a Lambertian emitting surface [32,33]. When simulating this LED package filled with clear resin in optical contact with the blue chip, we found a reduction of the total outcoupled blue light from the LED package by 15%–20%. Because this was in good agreement with the experimental results when filling the blue LED package with clear resin, we assume also for the encapsulated blue LED chip an EQE of 70%. Also when simulating the radiation pattern of the blue LED package filled with clear resin, we found a good match with the measured radiation pattern. This can be seen in Fig. 3(c).

    (a) Simulated and measured spectral power distribution of resin samples with different phosphor loadings: Sample 1 (1 mL resin+0.32 g YAG:Ce), Sample 2 (1 mL resin+0.082 g YAG:Ce), and Sample 3 (1 mL resin+0.025 g YAG:Ce). (b) Simulated/measured spectra of LED coated with 1 mL resin mixed with 0.048 g YAG:Ce. (c) Simulated/measured radiation pattern of LED package filled with clear resin.

    Figure 3.(a) Simulated and measured spectral power distribution of resin samples with different phosphor loadings: Sample 1 (1  mLresin+0.32g YAG:Ce), Sample 2 (1  mLresin+0.082g YAG:Ce), and Sample 3 (1  mLresin+0.025g YAG:Ce). (b) Simulated/measured spectra of LED coated with 1 mL resin mixed with 0.048 g YAG:Ce. (c) Simulated/measured radiation pattern of LED package filled with clear resin.

    D. Single-Event Optical Properties of the Luminescent Color Converters

    The spectral luminous flux of a phosphor-converted LED package depends strongly on the scattering, absorption, emission, and PLQY of all luminescent materials included. These optical phenomena can be accurately modeled with the commercial ray-tracer LightTools, including multiple scattering and phosphor re-absorption [34]. The underlying model is a Monte Carlo implementation of the fluorescent radiative transfer equation [35]. To solve correctly, this model needs the scattering coefficient (μs), the scattering phase function [P(ν,ν)], the absorption coefficient (μa), the emission spectrum, and the PLQY of all involved fluorescent materials. It is, however, very difficult to measure these properties directly, as measured quantities of luminescent materials are often the result from the repetitive absorption, scattering, and emission of photons before they escape from the sample. Such multiple events can result in an ostensibly smaller photoluminescence quantum efficiency [36], redshifted emission spectra [37], and inaccurate scattering parameters [38]. One way to mitigate these effects is to measure the optical properties of highly diluted samples. This approach, however, is often limited since measurements need a sufficient signal-to-noise ratio and light can be trapped by total internal reflection. Alternatively, reliable simulation parameters can be obtained by a reverse modeling approach.

    For obtaining accurate single-event properties via reverse modeling, we prepared a series of thin phosphor films with fixed dimensions and different phosphor loadings. The absorbance of these films was measured in a PerkinElmer spectrophotometer. Photoluminescence spectra were obtained by exiting from the films in an integrating sphere [39] by a blue laser. Figure 3(a) shows an example for YAG:Ce phosphor. For the inorganic phosphor powders, the scattering properties were derived via Mie theory, for which the material density and particle size distribution were provided by the manufacturers. We neglected scattering by the QDs, since the scattering cross section is much smaller than the absorption cross section in this case [40].

    We start from the listed (if available) material properties and slightly adjust these properties in the simulation model of the phosphor films until we obtain a good match of the measured and simulated spectral radiant flux [Fig. 3(a)]. A detailed discussion of the estimation accuracy of this method falls beyond the scope of this paper, but similar methodologies have also been described in the literature [41].

    An overview of the relevant parameters and obtained spectra for all considered materials in this paper are given in Table 1 and Fig. 4, respectively. Wavelengths in parentheses after the material name represent the emission peak wavelength (PWL). Three different red QDs with PWL at 605, 611, and 618 nm were characterized. As shown, all of these QDs have FWHM=45±5  nm. Because single particle emission spectra of 15–25 nm wide were reported for red InP/ZnSe QDs, this 45 nm linewidth is caused by heterogeneous broadening [42]. Since both absorption and scattering coefficients scale inversely with the used phosphor/QD loading in the LED package; the values for μa and μs are specified for the used loadings in QD-LED4 (see Section 3.B). To make QD-LED4, we mixed 1 mL of UV curable resin with 0.093 g YAG:Ce, 0.19 g LuAG:Ce, and 30 μL of QDs (611 nm) from a 568 μmol/L QD solution.

    Scattering/Absorption Coefficient and PLQY of Fluorescent Materials

     InP/ZnSe QDsYAG:Ce (545 nm)LuAG:Ce (516 nm)
    μs (at 450 nm) [mm-1]03.51.95
    μa (at 450 nm) [mm-1]0.440.720.33
    PLQY [%]75–809892

    Emission/absorption spectrum of YAG:Ce (545 nm), LuAG:Ce (516 nm), and red InP/ZnSe quantum dots.

    Figure 4.Emission/absorption spectrum of YAG:Ce (545 nm), LuAG:Ce (516 nm), and red InP/ZnSe quantum dots.

    3. RESULTS AND DISCUSSION

    A. Theoretical Color Rendering and Efficacy of QD-LEDs

    We used a theoretical emission spectrum (see Section 2) to investigate the maximal Ra/R9 and corresponding LE values that can be obtained by a phosphor-converted white LED that includes red-emitting QDs. This theoretical emission spectrum is chosen to be representative of white LEDs with good color rendering performance (Ra>80) and allowed us to identify trends in the relation between LE, color rendering, and QD emission linewidth.

    The influence of the center wavelength (λr) and FWHM of the red QD emission band on the Ra, R9, and LE values was calculated using the Python LuxPy package [24]. Figure 5 shows Ra, R9, and LE values of the theoretical emission spectrum (CCT=4000K) as a function of the PWLs and FWHM of the red QD emission.

    (a) Ra, (b) R9, and (c) LE values of the cropped backbody spectrum (CCT=4000 K) for different red peak wavelengths and FWHM. The purple isocurve connects the points where Ra has a value of 93, and the R9 values on the curve are approximately 50, while LE changes but only slightly. As an example, the three points in panel (c) indicate the exact values of LE for three different FWHMs; one can notice that red QDs with more narrow FWHM must emit at longer wavelengths to achieve the same Ra/R9 values. As a result, differences in LE values are limited. Graph (d) shows the dependence of LE on FWHM, for the case when Ra is 93.

    Figure 5.(a) Ra, (b) R9, and (c) LE values of the cropped backbody spectrum (CCT=4000K) for different red peak wavelengths and FWHM. The purple isocurve connects the points where Ra has a value of 93, and the R9 values on the curve are approximately 50, while LE changes but only slightly. As an example, the three points in panel (c) indicate the exact values of LE for three different FWHMs; one can notice that red QDs with more narrow FWHM must emit at longer wavelengths to achieve the same Ra/R9 values. As a result, differences in LE values are limited. Graph (d) shows the dependence of LE on FWHM, for the case when Ra is 93.

    As the center wavelength of the red emission shifts toward longer wavelengths and the emission line broadens, both Ra and R9 increase, while the LE decreases. Taking an FWHM of 45 nm, a realistic value for InP-based QDs, we find that Ra reaches 90 for a wavelength of 613 nm, while R9 would exceed 50 for a wavelength of 618 nm; the Ra at this wavelength is 93. Under these conditions, the LE amounts to 292 lm/W. Further shifts to longer wavelengths lead to additional increases of Ra and R9, yet this improved color rendering concurs with a strong reduction of the LE. Considering a narrower emission line of 30 nm, which would be characteristic of CdSe-based QDs, a wavelength of 616 nm is needed to attain Ra values exceeding 90, but 621 nm is required to reach R9 of 50 (Ra=93, LE=297lm/W). For the extreme case when FWHM=15nm (Ra=93, R9=50), LE is only slightly higher and is 300 lm/W. Interestingly, the additional redshift to attain good color rendering partially offsets the efficiency benefits imparted by a narrower emission line. To highlight the trade-off between color rendering and LE that comes with a narrower emission line, Fig. 5(d) represents the LE as a function of the width of the emission line along the Ra=93 isocurve that is represented as the purple line in Figs. 5(a)–5(c). One indeed sees that the reduction of the LE with increasing FWHM is limited to a mere 0.33 lm/W per 1 nm increase of the FWHM. Hence, an increase in linewidth from 30 to 45 nm only results in an LE drop from 297 to 292 lm/W, i.e., merely 2% for the given choice of Ra. Since the Ra=93 isocurve largely coincides with the R9=50 isocurve, we conclude that white QD-LEDs can achieve a theoretical LE between 285 and 300 lm/W in combination with Ra90 and R9 50 for emission lines centered at around 620 nm and having an FWHM below 50 nm.

    When considering the above results, it is important to acknowledge that the actual values for Ra, LE, and especially R9 will depend on the specific spectral shape of the white LED emission. Differences in the broadband green-yellow phosphor emission will result in different color rendering and LE values. While analyzing specific phosphors (combinations), we have found that the important trade-off between the FWHM of the red QD emission and resulting LE for a specific color rendering performance is always similar (to a few percent), provided that the resulting color point is the same. This motivates that the results in Fig. 4 are representative for the impact of the red QD emission FWHM on color rendering and LE.

    B. Experimental White Light Spectra of InP-Based QD-LEDs

    For this study, we used InP/ZnSe QDs with an emission linewidth of 45  nm. According to the theoretical estimates represented in Fig. 5, white QD-LEDs with Ra90 and R9 50 can be obtained with such a linewidth, provided that the central emission line is around 620 nm. Importantly, this central emission of 620 nm refers to the QD emission as retrieved in the white light spectrum. This emission line can be redshifted from the (single-event) emission spectrum of the QDs because of their self-absorption [43]. Such effects will depend on the properties and the concentration of all used luminescent materials in the color-converter resin, i.e., phosphors and QDs. To anticipate this redshift, QD-LEDs were prepared using InP/ZnSe QDs with a single-event emission line centered at 605 nm.

    As a first reference QD-LED, we prepared color-converter resins containing a YAG:Ce phosphor with PWL at 545 nm (YAG:Ce 545) as a broadband phosphor and red InP/ZnSe QDs with a single-event peak emission at 605 nm and a PLQY of 75%. As can be seen in Fig. 6, the resulting white light spectrum of QD-LED1 consists of a combination of the YAG:Ce and the QD emission—the latter giving an additional band centered at 610 nm. The white LED1 has a fairly high efficiency of 143 lm/W because most of the light is emitted near the maximum of the luminous efficiency function. The color rendering, however, is moderate with Ra=80 and R9=2 for a CCT of 4100 K with chromaticity coordinates (x=0.3776, y=0.3837). Comparing the QD-LED1 spectrum with the theoretical spectrum shown in Fig. 1 (see Section 2) and the theoretical color rendering estimates shown in Fig. 5, we see two reasons for the moderate color rendering of the QD-LED1 spectrum. First, the spectrum features a significant cyan gap between the blue LED emission line and the YAG:Ce emission band, which is absent in the theoretical spectrum. Second, the effective position of the QD emission band at 610 nm is 10 nm to the blue of the preferred central wavelength between 615 and 620 nm.

    LED1, measured spectral power distribution of the white QD-LED with Ra=80. This white LED has a CCT ≈ 4100 K and an LE of 143 lm/W.

    Figure 6.LED1, measured spectral power distribution of the white QD-LED with Ra=80. This white LED has a CCT 4100  K and an LE of 143 lm/W.

    To overcome these limitations, we replaced YAG:Ce 545 by a LuAG:Ce phosphor with peak emission at 516 nm (QD-LED2). As can be seen in Fig. 7, the use of LuAG:Ce 516 significantly reduces the cyan gap in the QD-LED2 spectrum and limits the red emission tail coming from the YAG:Ce 545 emission in QD-LED1. This results in Ra=91, R9=23, and LE=127 lm/W. In order to further improve the color rendering performance, the red QDs with peak emission at 605 nm were changed by red QDs with peak emission at 611 nm (QD-LED3). With Ra=94 and R9=84, QD-LED3 offers excellent color rendering. This result, however, is attained at the cost of a lower LE, which only reaches 113 lm/W.

    LED2, white QD-LED with the cyan region perfectly filled by using the LuAG:Ce phosphor, resulting in Ra>90 (CCT ≈4200 K, x=0.3755, y=0.3888). LED3, measured spectral power distribution of the white LED using LuAG:Ce (516 nm) and red-emitting QDs (611 nm). It has both high Ra=94 and R9=84 (CCT ≈4400 K, x=0.3618, y=0.3557).

    Figure 7.LED2, white QD-LED with the cyan region perfectly filled by using the LuAG:Ce phosphor, resulting in Ra>90 (CCT 4200  K, x=0.3755, y=0.3888). LED3, measured spectral power distribution of the white LED using LuAG:Ce (516 nm) and red-emitting QDs (611 nm). It has both high Ra=94 and R9=84 (CCT 4400  K, x=0.3618, y=0.3557).

    As previously mentioned, Ra90 and R9 50 are currently recommended standards for color rendering. From this perspective, QD-LED3 overdoes the trade-off between efficacy and color rendering. The reduction of the cyan gap clearly reduces efficacy. A better balance between efficacy and color rendering was found by means of a color-converter resin based on an optimized mixture of LuAG:Ce 516, YAG:Ce 545, and InP/ZnSe QDs with a single-event peak emission at 611 nm and a PLQY of 78%. As shown in Fig. 8, the resulting spectrum (QD-LED4) features a spectral radiant flux with CCT4100  K (x=0.3829, y=0.3974), Ra=88, R9=47, and LE of 132 lm/W. A similar phosphor combination was used to fabricate 3000 K white LEDs (see Fig. 9). Hence, in line with the theoretical estimates, we find that InP-based QD-LEDs can reach current color rendering standards, despite a relatively broad emission line of 45 nm.

    LED4, measured spectral power distribution of the white LED using LuAG:Ce (516 nm), YAG:Ce (545 nm), and red-emitting QDs (611 nm) as luminescent materials. This LED balances color rendering and LE performance.

    Figure 8.LED4, measured spectral power distribution of the white LED using LuAG:Ce (516 nm), YAG:Ce (545 nm), and red-emitting QDs (611 nm) as luminescent materials. This LED balances color rendering and LE performance.

    Spectra of different white LEDs with similar color rendering performance (Ra=90/R9≈50) for CCT=3000 K and 4000 K. The white LEDs with red-emitting nitride-based phosphor induce clearly much more lumen loss compared to the QD-based LEDs due to the broad red tail that extends far beyond the human eye sensitivity curve.

    Figure 9.Spectra of different white LEDs with similar color rendering performance (Ra=90/R950) for CCT=3000K and 4000 K. The white LEDs with red-emitting nitride-based phosphor induce clearly much more lumen loss compared to the QD-based LEDs due to the broad red tail that extends far beyond the human eye sensitivity curve.

    C. Luminous Efficacy of Radiation

    Since the white light QD-LED4 spectrum meets current color rendering standards, we used that spectrum as a starting point to compare the LER for different white LEDs. The LER of a given spectrum is defined as the ratio of the luminous flux to the radiant flux, a ratio that depends on the position and the width of the QD emission band. The white LEDs that are considered in this comparison all have similar color rendering properties (Ra90 and R9 50), but use either InP/ZnSe QDs, Cd-based QDs, or a nitride phosphor as the red-emitting color converter. Moreover, we evaluated spectra of white LEDs with a CCT of both 4000 and 3000 K. While the white LEDs based on InP/ZnSe QDs were prepared and measured in our lab, we used the spectral power distribution for the 3000 K LEDs with Cd-based QDs and nitride phosphors as published by Estrada et al. [6], and data on 4000 K LEDs were measured from two commercially available packages, i.e., the OSRAM Osconiq LED [44] with red-emitting Cd-based QDs and the LUXEON 3535 LED [45] package with a red-emitting nitride phosphor (this package was an updated/newer version of the used LED package for the InP/ZnSe QD-LEDs, with slightly different geometry).

    In Fig. 9, we represent the different 3000 and 4000 K white LED spectra, normalized to the same total output power, while Table 2 summarizes the corresponding LERs. Considering the 3000 K LEDs first, one sees that the narrower red emission of the two white QD-LEDs results in considerably larger LER as compared to the white LED with a nitride phosphor. More precisely, we find that the LER of the InP-based QD-LED spectrum is 17% larger than the nitride-based LED. Clearly, this is the result of the broad, red emission tail of the nitride phosphor, which extends well beyond the human eye sensitivity curve. On the other hand, the replacement of InP-based QDs by Cd-based QDs only results in a moderate increase of the LER by 4.5%. In line with our theoretical estimates, this limited impact of a more narrow emission line on the LER can also be linked to the slight redshift of the emission line that is needed to preserve good color rendering. In the case of the 4000 K white LEDs, we similarly find that the LER of the nitride-based white LED is 18.2% smaller than that of the InP-based QD-LED. Opposite from our theoretical results, however, we find that the LER of the OSRAM Osconiq LED is smaller than of QD-LED4, even if the former LED uses Cd-based QDs. Looking at the spectrum of the OSRAM Osconiq LED, this is also the result of the relatively broad, red emission peak that is also present in this case. A possible reason for this is the wider than expected emission line of the Cd-based QDs, but also the extension of the emission of the powder phosphor(s) in the far-red region is certainly possible. We, thus, conclude that, while the replacement of broad emitting, nitride-based phosphors by QDs can significantly improve the LER of white LEDs, it is the overall phosphor-QD mixture that determines the final LER gains. In particular, the modest efficacy improvements expected for more narrow QD emission lines can easily be undone by the choice of the green-yellow phosphor in the color converter.

    Luminous Efficacy of Radiation of White LEDs with Different Luminescent Materials for the Red Emission

    LED TypeLER (lm/W)Compared to InP QDs
    3000K nitride phosp. [6]274−17%
    3000K Cd-based QDs [6]340+4.5%
    3000K InP/ZnSe QDs325
    4000K nitride phosp. [45]285−18.2%
    4000K Cd-based QDs [44]314−8.4%
    4000K InP/ZnSe QDs345

    D. Luminous Efficacy of InP-Based White LEDs

    While the LER of the QD-LED4 spectrum amounts to 345 lm/W, the actual QD-LED’s LE was 132 lm/W only, as indicated in Section 3.B. For the LUXEON 3535 white LED with nitride phosphors (LER=285 lm/W), we measured an LE of 144 lm/W. For the OSRAM Osconiq LED with Cd-based QDs (LER=314 lm/W), we measured an LE of 170 lm/W. So despite the larger LER of the InP/ZnSe QD-LED, the measured LE of this LED is significantly smaller than the measured LE of the other considered white LEDs at CCT=4000K.

    To get more detailed insight into the QD-LED energy power budget, the different loss mechanisms, and the resulting efficacy, we simulated the output spectrum of QD-LED4 using the geometry of the LED package and the properties of the different converter materials as input (see Section 2). Figure 10(a) represents the experimental and simulated spectral radial flux, where the excellent match between both provides a solid basis to quantify the losses. Considering the measured wall-plug efficiency of 70% for the blue LED, the simulated output spectrum yields a total power budget for QD-LED4, as depicted in Fig. 10(b). According to this diagram, we attribute the optical losses—expressed as a fraction of the total power budget—of QD-LED4 to: (13.5%) Stokes losses in the luminescent materials.(11.5%) Absorption losses within the LED package, for example related to non-perfect reflective interfaces.(6%) Non-radiative losses due to a non-unity PLQY of the luminescent materials.(1%) Absorption losses in the polymer binder.

    (a) Measured spectral power distribution of the demonstrated InP/ZnSe QD-LED4 (CCT=4000 K, LE=132 lm/W) and corresponding simulated spectrum. (b) Pie chart of the various power losses in the demonstrated QD-LED4. The different loss mechanisms were estimated with the developed simulation model in LightTools.

    Figure 10.(a) Measured spectral power distribution of the demonstrated InP/ZnSe QD-LED4 (CCT=4000K, LE=132 lm/W) and corresponding simulated spectrum. (b) Pie chart of the various power losses in the demonstrated QD-LED4. The different loss mechanisms were estimated with the developed simulation model in LightTools.

    As a result, 38% of the electric power is retrieved as optical power yielding an LE of 132 lm/W.

    While Stokes losses or reflection losses are difficult, if not impossible to avoid, a further enhancement of the LE can result from an increased wall-plug efficiency of the blue LED and a higher PLQY of the luminescent materials. Using our simulation model for QD-LED4, we evaluated both aspects of the power budget separately. In Fig. 11(a), the variation of the LE with the blue chip efficiency is shown, when the PLQY of the red QDs equals 80%. As can be expected, the QD-LED efficacy increases linearly with the wall-plug efficiency to reach a maximum of 188.5 lm/W for a 100% efficient electrical to optical power conversion. While this figure remains well below the LER of 345 lm/W, this result also shows that a considerable gain of around 2 lm/W can be made for every percentage increase of the wall-plug efficiency of the blue LED. As compared to such gains, the impact of a further rise of the PLQY of the InP/ZnSe QDs is more limited. In Fig. 11(b), the variation of the LE with the PLQY of the red QDs is shown when the blue chip efficiency equals 70%. The relation between the LE of the QD-LED and the PLQY of the red QDs is clearly non-linear where the gains of increasing the PLQY drop for the highest PLQYs. This non-linear relation is a direct consequence of the multiple re-absorption effects that occur in the white QD-LED. If the PLQY of the red QDs is lower, a higher QD concentration is needed to reach the same color point. This higher QD concentration not only results in more absorption of blue light but also more absorption of the green-yellow light emitted by the YAG:Ce and LuAg:Ce phosphors and also more self-absorption of red light emitted by the QDs themselves. The negative impact of these multiple re-absorption effects on the LE increases considerably when the PLQY of the QDs is lower. As a result, replacing 80% efficient by 100% efficient QDs only increases the LE from 132 to 141 lm/W, whereas using 40% efficient QDs would reduce the LE to 104 lm/W. In order to evaluate the combined impact of both the blue chip and red QD efficiency on the LE, one can simply multiply the linear increase as a consequence of the blue chip efficiency increase, with the non-linear increase as a consequence of the red QD PLQY increase. This would result, for example, in an LE=(0.7)1×141,201=lm/W for a perfect efficiency of both the blue LED and red QDs.

    Predicted luminous efficacy values of the InP/ZnSe QD-LED with CCT = 4000 K for (a) varying wall-plug efficiency of the blue LED chip and (b) varying quantum yield of the InP/ZnSe quantum dots.

    Figure 11.Predicted luminous efficacy values of the InP/ZnSe QD-LED with CCT = 4000 K for (a) varying wall-plug efficiency of the blue LED chip and (b) varying quantum yield of the InP/ZnSe quantum dots.

    Despite the larger LER of the InP/ZnSe QD-LED, the measured LE was lower than that of the other two considered white LEDs at CCT=4000K. The power budget estimates made in the above paragraphs indicate that this difference is not mainly caused by the use of poor red-emitting QDs, but rather the lower wall-plug efficiency of the blue LED chip or the lower light recycling ability of the used package. Taking these considerations into account, we conclude that a combination of traditional inorganic phosphors and InP/ZnSe QDs can lead to white QD-LEDs that combine high efficiency with excellent color rendering, a result that is not hampered by emission lines being 45 nm wide.

    4. CONCLUSION

    In this study, we show that InP/ZnSe QDs with an FWHM bandwidth of 45 nm and a quantum efficiency of nearly 80% offer a competitive alternative to already well-developed and commercially available Cd-based QDs. Both our theoretical calculations and experimental results show that the efficiency penalty for the wider emission spectrum compared to narrowband Cd-based QDs remains under 5% in all cases. The best result using a Lumileds 3535 package with a blue chip wall-plug efficiency of 70% is an overall LE of 132 lm/W for Ra90, R950, at CCT 4000  K. Using the developed simulation model, we showed that this result corresponds with 94% of the maximal possible LE with this package in the case that QD materials would have had a unity quantum yield.

    In this paper, we considered the optical properties and application of InP/ZnSe QDs for white LEDs with good color rendering and high efficacy. In future work, we will address the reliability of the InP/ZnSe QDs under high flux-densities and elevated temperature, as well as the process ability of these QDs.

    Acknowledgment

    Acknowledgment. We are grateful to Lumileds for providing us with a large batch of empty 3535 LED packages and relevant information about this specific package. Special thanks also go to Prof. Philippe Smet and Prof. Kevin Smet for some useful suggestions and guidelines.

    References

    [1] P. Morgan Pattison, M. Hansen, J. Y. Tsao. LED lighting efficacy: status and directions. C. R. Phys., 19, 134-145(2018).

    [2] C. I. del Eclairage. Measuring and specifying colour rendering properties of light sources(1995).

    [3] K. Houser, M. Mossman, K. Smet, L. Whitehead. Tutorial: color rendering and its applications in lighting. LEUKOS, 12, 7-26(2016).

    [4] M. Wright. California tightens color performance of LED based lamps(2016).

    [5] M. Wei, K. W. Houser, A. David, M. R. Krames. Perceptual responses to LED illumination with colour rendering indices of 85 and 97. Light. Res. Technol., 47, 810-827(2015).

    [6] D. Estrada, K. Shimizu, M. Bohmer, S. Gangwal, T. Diederich, S. Grabowski, G. Tashjian, D. Chamberlin, O. B. Shchekin, J. Bhardwaj. 32-1: on-chip red quantum dots in white LEDs for general illumination. SID Symp. Dig. Tech. Pap., 49, 405-408(2018).

    [7] H. F. Sijbom, R. Verstraete, J. J. Joos, D. Poelman, P. F. Smet. K2SiF6:Mn4+ as a red phosphor for displays and warm-white LEDs: a review of properties and perspectives. Opt. Mater. Express, 7, 3332-3365(2017).

    [8] X. Fan, T. Wu, B. Liu, R. Zhang, H. C. Kuo, Z. Chen. Recent developments of quantum dot based micro-LED based on non-radiative energy transfer mechanism. Opto-Electron. Adv., 4, 21002201(2021).

    [9] A. Tierno, T. Ackemann, C. G. Leburn, C. T. Brown. Saturation of absorption and gain in a quantum dot diode with continuous-wave driving. Appl. Phys. Lett., 97, 231104(2010).

    [10] A. P. Alivisatos. Semiconductor clusters, nanocrystals, and quantum dots. Science, 271, 933-937(1996).

    [11] S. Abe, J. J. Joos, L. I. Martin, Z. Hens, P. F. Smet. Hybrid remote quantum dot/powder phosphor designs for display backlights. Light Sci. Appl., 6, e16271(2017).

    [12] J. Kurtin, B. Mangum, B. Theobald. On-chip quantum dots for high color gamut displays. Dig. Tech. Pap. SID Int. Symp., 48, 447-450(2017).

    [13] B. D. Mangum, T. S. Landes, B. R. Theobald, J. N. Kurtin. Exploring the bounds of narrow-band quantum dot downconverted LEDs. Photon. Res., 5, A13-A22(2017).

    [14] OSRAM Opto. Quantum dots from OSRAM make LEDs even more efficient.

    [15] R. Guide. RoHS initiatives worldwide(2021).

    [16] . Compliance FAQs: RoHS(2020).

    [17] J. Ziegler, S. Xu, E. Kucur, F. Meister, M. Batentschuk, F. Gindele, T. Nann. Silica-coated InP/ZnS nanocrystals as converter material in white LEDs. Adv. Mater., 20, 4068-4073(2008).

    [18] S. Kim, T. Kim, M. Kang, S. K. Kwak, T. W. Yoo, L. S. Park, I. Yang, S. Hwang, J. E. Lee, S. K. Kim, S. W. Kim. Highly luminescent InP/GaP/ZnS nanocrystals and their application to white light-emitting diodes. J. Am. Chem. Soc., 134, 3804-3809(2012).

    [19] K. T. Shimizu, M. Böhmer, D. Estrada, S. Gangwal, S. Grabowski, H. Bechtel, E. Kang, K. J. Vampola, D. Chamberlin, O. B. Shchekin, J. Bhardwaj. Toward commercial realization of quantum dot based white light-emitting diodes for general illumination. Photon. Res., 5, A1-A6(2017).

    [20] Q. A. Akkerman, G. Rainò, M. V. Kovalenko, L. Manna. Genesis, challenges and opportunities for colloidal lead halide perovskite nanocrystals. Nat. Mater., 17, 394-405(2018).

    [21] H. Chen, J. He, S.-T. Wu. Recent advances on quantum-dot-enhanced liquid-crystal displays. IEEE J. Sel. Top. Quantum Electron., 23, 1900611(2017).

    [22] G. Harbers, C. Hoelen. LP-2: high performance LCD backlighting using high intensity red, green and blue light emitting diodes. SID Symp. Dig. Tech. Pap., 32, 702-705(2001).

    [23] Z. Liu, C. H. Lin, B. R. Hyun, C. W. Sher, Z. Lv, B. Luo, F. Jiang, T. Wu, C. H. Ho, H. C. Kuo, J. H. He. Micro-light-emitting diodes with quantum dots in display technology. Light Sci. Appl., 9, 1(2020).

    [24] K. A. Smet. Tutorial: the LuxPy Python toolbox for lighting and color science. LEUKOS, 16, 179-201(2020).

    [25] E. Dhaene, J. Billet, E. Bennett, I. Van Driessche, J. De Roo. The trouble with ODE: polymerization during nanocrystal synthesis. Nano Lett., 19, 7411-7417(2019).

    [26] M. P. Hendricks, M. P. Campos, G. T. Cleveland, J. L. P. Ilan, J. S. Owen. A tunable library of substituted thiourea precursors to metal sulfide nanocrystals. Science, 348, 1226-1230(2015).

    [27] https://formlabs.com/store/clear-resin/. https://formlabs.com/store/clear-resin/

    [28] P. Hanselaer, A. Keppens, S. Forment, W. R. Ryckaert, G. Deconinck. A new integrating sphere design for spectral radiant flux determination of light-emitting diodes. Meas. Sci. Technol., 20, 095111(2009).

    [29] https://www.synopsys.com/optical-solutions/lighttools.html. https://www.synopsys.com/optical-solutions/lighttools.html

    [30] K. Wang, S. Liu, X. Luo, D. Wu. Freeform Optics for LED Packages and Applications(2017).

    [31] J. K. Kim, H. Luo, E. F. Schubert, J. Cho, C. Sone, Y. Park. Strongly enhanced phosphor efficiency in GaInN white light-emitting diodes using remote phosphor configuration and diffuse reflector cup. Jpn. J. Appl. Phys., 44, L649-L651(2005).

    [32] C.-C. Sun, T.-X. Lee, S.-H. Ma, Y.-L. Lee, S.-M. Huang. Precise optical modeling for LED lighting verified by cross correlation in the midfield region. Opt. Lett., 31, 2193-2195(2006).

    [33] I. Moreno, C.-C. Sun. Modeling the radiation pattern of LEDs. Opt. Express, 16, 1808-1819(2008).

    [34] M. W. Zollers, H. Yang, J. H. Melman, S. R. David, G. Wang, X. Xu. Process to measure particulate down-converting phosphors and create well-correlated software models of LED performance. Proc. SPIE, 7954, 795414(2011).

    [35] Y. Ma, M. Wang, J. Sun, R. Hu, X. Luo. Phosphor modeling based on fluorescent radiative transfer equation. Opt. Express, 26, 16442-16455(2018).

    [36] J. Ryckaert, A. Correia, M. D. Tessier, D. Dupont, Z. Hens, P. Hanselaer, Y. Meuret. Selecting the optimal synthesis parameters of InP/CdxZn1-x Se quantum dots for a hybrid remote phosphor white LED for general lighting applications. Opt. Express, 25, A1009-A1022(2017).

    [37] W. Zhang, D. Dai, X. Chen, X. Guo, J. Fan. Red shift in the photoluminescence of colloidal carbon quantum dots induced by photon reabsorption. Appl. Phys. Lett., 104, 091902(2014).

    [38] S. Leyre, Y. Meuret, G. Durinck, J. Hofkens, G. Deconinck, P. Hanselaer. Estimation of the effective phase function of bulk diffusing materials with the inverse adding-doubling method. Appl. Opt., 53, 2117-2125(2014).

    [39] S. Leyre, E. Coutino-Gonzalez, J. J. Joos, J. Ryckaert, Y. Meuret, D. Poelman, P. F. Smet, G. Durinck, J. Hofkens, G. Deconinck, P. Hanselaer. Absolute determination of photoluminescence quantum efficiency using an integrating sphere setup. Rev. Sci. Instrum., 85, 123115(2014).

    [40] J. Li, Y. Tang, Z. Li, X. Ding, D. Yuan, B. Yu. Study on scattering and absorption properties of quantum-dot-converted elements for light-emitting diodes using finite-difference time-domain method. Materials, 10, 1264(2017).

    [41] Z. Liu, S. Liu, K. Wang, X. Luo. Measurement and numerical studies of optical properties of YAG:Ce phosphor for white light-emitting diode packaging. Appl. Opt., 49, 247-257(2010).

    [42] I. Moreels, J. C. Martins, Z. Hens. Solution NMR techniques for investigating colloidal nanocrystal ligands: a case study on trioctylphosphine oxide at InP quantum dots. Sens. Actuators B, 126, 283-288(2007).

    [43] J. S. Li, Y. Tang, Z. T. Li, K. Cao, C. M. Yan, X. R. Ding. Full spectral optical modeling of quantum-dot-converted elements for light-emitting diodes considering reabsorption and reemission effect. Nanotechnology, 29, 295707(2018).

    [44] https://www.osram.com/ecat/OSCONIQ%C2%AE%20S%203030%20GW%20QSLM31.QM/com/en/class_pim_web_catalog_103489/prd_pim_device_8390008. https://www.osram.com/ecat/OSCONIQ%C2%AE%20S%203030%20GW%20QSLM31.QM/com/en/class_pim_web_catalog_103489/prd_pim_device_8390008

    [45] https://www.lumileds.com/products/mid-power-leds/luxeon-3535l/. https://www.lumileds.com/products/mid-power-leds/luxeon-3535l/

    Bega Karadza, Hannes Van Avermaet, Leila Mingabudinova, Zeger Hens, Youri Meuret. Efficient, high-CRI white LEDs by combining traditional phosphors with cadmium-free InP/ZnSe red quantum dots[J]. Photonics Research, 2022, 10(1): 155
    Download Citation