
Xiaobao Zhang, Guoping Lin, Tang Sun, Qinghai Song, Guangzong Xiao, Hui Luo, "Dispersion engineering and measurement in crystalline microresonators using a fiber ring etalon," Photonics Res. 9, 2222 (2021)
- Photonics Research
- Vol. 9, Issue 11, 2222 (2021)
Abstract
1. INTRODUCTION
Optical microresonators with small mode volumes and ultrahigh quality (Q) factors can significantly decrease the threshold power of parametric oscillations, which makes them an ideal platform for optical frequency comb generation [1–6]. Since Kerr frequency combs were demonstrated in a silica toroidal cavity in 2007 [7], they have been utilized in applications such as spectroscopy [8,9], optical atomic clocks [10,11], astronomical calibration [12,13], coherent communications [14,15], low-noise frequency synthesis [16,17], laser ranging [18–20], and photonic convolutional processing [21,22]. Dispersion as one of key parameters of Kerr microcombs, usually referred to as the group velocity dispersion (GVD) of cavity modes, is preferred to be in the anomalous regime [2,23–27]. Although Kerr frequency combs can be obtained in the normal dispersion regime under some special conditions [28–33], the spectral width is typically limited. Moreover, the dispersive wave caused by the optical analog of Cherenkov radiation may occur when a Kerr soliton comb extends into a region where second order dispersion changes sign [34]. These waves play an important role in spectral control and can provide quiet states of soliton comb operation [35]. In addition, the dispersion of microresonators has a large influence on quantum optics, which needs high coherences [36,37].
The dispersion of microresonators is mainly determined by two parts: material and geometric dispersion. Therefore, dispersion engineering is realized by controlling these two parts. Extensive works have been contributed in this field. For instance,
There have been several methods for the measurement of the microresonator dispersion [46]. One of the common ways is frequency-comb-based spectroscopy [47–49]. In this way, the frequency-comb laser intervenes with the scanning continuous-wave laser, which is injected in the microresonator. Then the beat signals of the two lasers are like a ruler and provide information of the scanning laser frequency. Another method is sideband spectroscopy based on electro-optic modulation [43,50,51]. Usually, an electro-optic phase modulator is utilized to generate sidebands of the scanning laser. The frequency difference between the sidebands and pump is equivalent to the modulation frequency generated by a radio-frequency (RF) source. Therefore, the laser frequency is linked with the known RF signals, and dispersion can be obtained. Although these two methods can provide high-precision dispersion measurements, the requirement of a commercial frequency comb laser or a tunable microwave source that can reach about one free spectral range (FSR) of the microresonator is usually difficult to meet for regular laboratory conditions. Thereby, other methods have been developed. For instance, a price-friendly fiber Mach–Zehnder interferometer (MZI) can be applied in dispersion measurement [52–54]. However, it usually needs to be calibrated by the two methods mentioned before, as it is difficult to get its FSR and dispersion from MZI fringes [46].
Sign up for Photonics Research TOC. Get the latest issue of Photonics Research delivered right to you!Sign up now
In this paper, we introduce a dispersion measurement method based on a fiber ring cavity that is cheap and easy to access. The FSR of the fiber cavity can be easily designed to be few tens of MHz. Moreover, unlike MZI, its FSR can be directly calibrated with a regular in-laboratory function generator without the presence of microresonators. Assisted by binary function fitting of the measurement data, the dispersion of the fiber cavity is assessed. Finally, the data can be used to derive the dispersion profile of the whispering gallery mode (WGM) family. The method is demonstrated on two
2. THEORY AND METHODS
The resonance frequency intervals between adjacent longitudinal modes should be the same in an ideal optical resonator without dispersion. Hence, the relative positions of the resonance frequencies can be used to characterize resonator dispersion. Generally, the resonance frequencies
The schematic of this dispersion measurement method is shown in Fig. 1(a). In the experiment, an external cavity diode laser (ECDL) with a linewidth of 10 kHz is used as the light source, and the transmission spectra of the two cavities are recorded at the same time with a four-channel oscilloscope. The fiber ring etalon is prepared using a
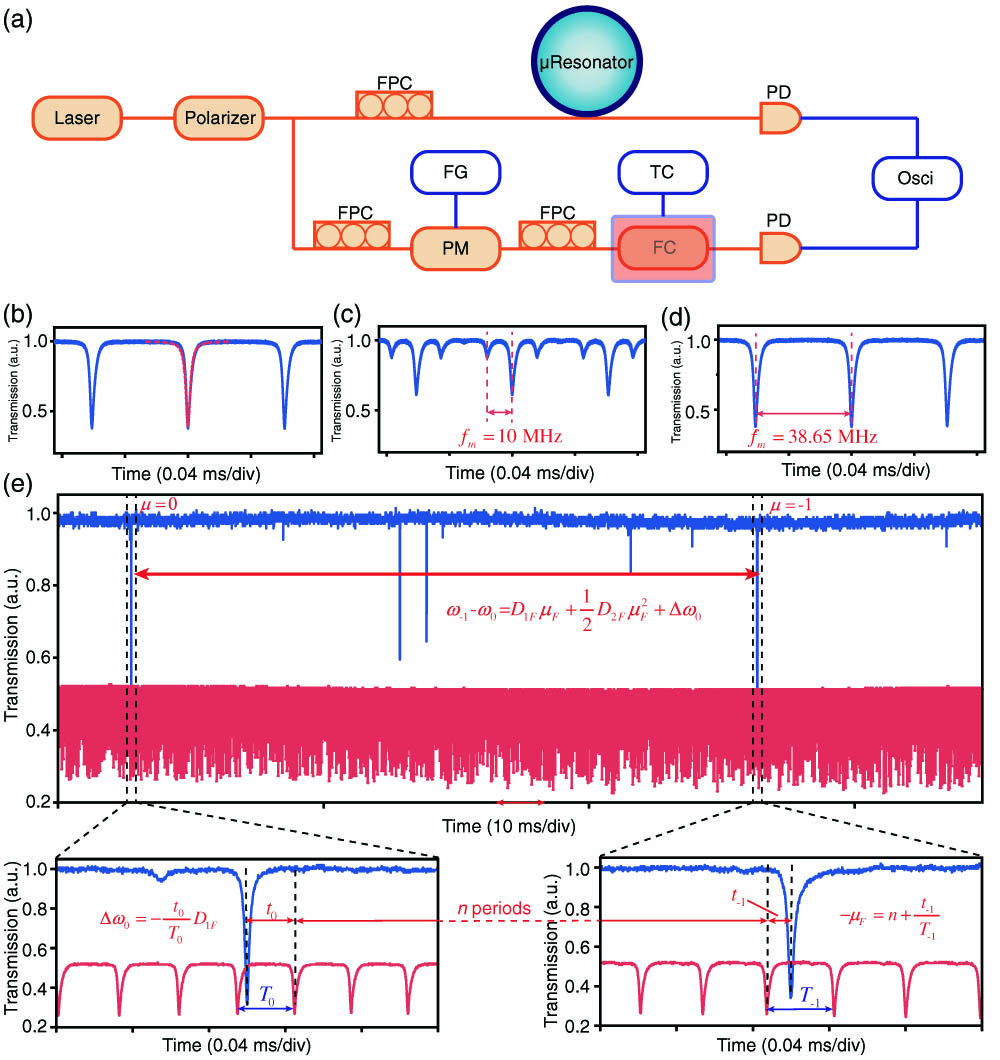
Figure 1.(a) Schematic of the experiment setup. Orange lines denote optical paths, and blue lines represent electric cables. A tapered fiber is employed to couple the laser in and out of the microresonator. The fiber cavity is put on a silicone rubber heater, and both of them are kept in a thermal insulation box. Temperature is set as 50°C in the experiment. FPC, fiber polarization controller; FG, function generator; PM, phase modulator; TC, temperature controller; FC, fiber cavity; PD, photodiode. (b) Transmission spectrum of the fiber cavity without phase modulation. The red dashed line is Lorentz fitting for the resonance, and the fitting shows that the loaded
As the transmission spectra of the fiber cavity and the
3. NUMERICAL EVALUATIONS OF WGM DISPERSION
Previous studies reveal that FEM is a reliable way to calculate microresonator dispersion, and its results are in good agreement with experimental ones [43,46,51]. Hence, FEM has been widely used in microresonator dispersion engineering. The numerical results can assist binary function fitting and provide a good assessment of the etalon reference. It is vital to build an effective geometrical model for FEM calculation as the material of the resonators is determined. Although the analytical approximation of eigenfrequencies of WGMs in toroidal disks has been used to investigate cavity dispersion for Kerr combs [58], FEM can provide better accuracy and flexibility. As shown in Fig. 2(a), different from previous spheroid models of
![]()
Figure 2.(a) Geometric model of
Different transverse azimuthal modes of these two microresonators are investigated by FEM. The mode index
![]()
Figure 3.(a) Electric field distribution of WGMR A with different azimuthal mode indices. (b) Simulation dispersion plot of
The influence of geometry parameters on WGM dispersion is also studied by FEM. Figure 4 demonstrates the calculation results of different geometry parameter settings of various azimuthal modes. In each subplot, except the scanning parameter, the other parameters remain unchanged in the calculation. The general settings are
![]()
Figure 4.Calculated
It is obvious from Fig. 4 that dispersion values of all three azimuthal modes have similar trend patterns with the specific geometry parameter scanning. However, higher order azimuthal modes are more sensitive to geometry parameters, as they show larger fluctuations in dispersion values. This could be explained by the fact that higher order azimuthal modes feature larger mode areas and their mode distributions can be easily influenced by boundary geometry changes. Moreover, compared to other geometry parameters,
4. RESULTS AND DISCUSSION
In the measurement, the laser scanning speed is set as 10 nm/s, and scanning range is 1530–1570 nm. The sampling rate of the oscilloscope is 5 MSa/s. Since the laser scanning speed is not constant through the whole operation, we choose to analyze the central data. The actual number of sampling points is about 23 million per channel for one scan, which means that the sampling precision of the laser frequency is about 200 kHz. The measurement data of WGMR A are processed based on the method introduced in Section 2. Figure 5(a) demonstrates the dispersion parameter including fiber cavity dispersion
![]()
Figure 5.(a) Measurement dispersion
As described in Section 2, the parameters obtained from binary function fitting are used to reprocess the measuring data according to Eq. (4). Then a quadratic fitting is applied in the reprocessed data to get
![]()
Figure 6.(a) Transmission spectrum of measured mode of WGMR A with
It is clear from Fig. 6(f) that the difference between experiments and FEM calculations is larger than those of the other two WGM families. The reason may be that the geometric error of the FEM model has a relative larger influence on higher order modes. We found that the FEM results of fundamental modes are similar in different geometric parameter settings. However, the FEM results are varied for higher order azimuthal modes, which could be thereby utilized for dispersion engineering, as shown in Section 3. Another possible reason is that this mode is affected by avoided mode crossings. Compared to the other two WGM results in Figs. 6(b) and 6(d), this mode has more obvious avoided mode crossings than other mode families, which may induce a relative larger difference in measurement results. Optical microresonators can host many transverse mode families, and these different mode families can interact with each other and distort the mode spectrum. The dispersion measurement results can be disturbed by mode crossings, and sometimes these mode interactions even change the sign of the effective dispersion in a specified wavelength range [35,59]. One way to reduce the number of mode crossings is to decrease the transverse modes that can be supported by resonators. Generally, this can be realized by limiting the cross-section area of the resonator, namely, decreasing the effective mode area, and much work has been done in this area [43,60,61]. As the
![]()
Figure 7.(a) Transmission spectrum of measured mode of WGMR A with
When measuring the FSR of a fiber cavity, it is found that the uncertainty is about
It should be mentioned that the
Compared to the spectroscopy method for dispersion measurements using a stabilized commercial frequency comb reference, this approach using a fiber ring cavity etalon provides less accurate measurements. It results from the fact that this method relies on many factors. For instance, the binary function fitting means that only second order dispersion parameters of both the reference and the microresonator are taken into consideration. Moreover, the sampling rate of the oscilloscope, the dimension measurement accuracy of the resonator, and the FEM estimation accuracy of the dispersion also affect dispersion measurement. Actually, a better solution is to fully calibrate the etalon using a fiber comb reference.
Although the dimension measurement accuracy of the resonator and the FEM estimation accuracy of the dispersion can affect dispersion measurement and their influence on measurement results is difficult and complex to estimate, it is still possible to evaluate the direct measurement results of
5. CONCLUSION
In conclusion, we have demonstrated an approach based on a fiber cavity etalon for microresonator dispersion measurement. The fiber ring etalon with a high loaded Q reaching one hundred million is cost efficient and easy to prepare. The FSR of this fiber cavity is measured by sideband modulation spectroscopy, and the dispersion of the etalon is assessed by binary function fitting assisted by FEM simulated results. Using this method, dispersion profiles of two different
References
[1] K. J. Vahala. Optical microcavities. Nature, 424, 839-846(2003).
[2] T. J. Kippenberg, S. M. Spillane, K. J. Vahala. Kerr-nonlinearity optical parametric oscillation in an ultrahigh-
[3] J. Li, H. Lee, T. Chen, K. J. Vahala. Low-pump-power, low-phase-noise, and microwave to millimeter-wave repetition rate operation in microcombs. Phys. Rev. Lett., 109, 233901(2012).
[4] G. Lin, A. Coillet, Y. K. Chembo. Nonlinear photonics with high-
[5] L. Ge, L. Feng, H. G. Schwefel. Optical microcavities: new understandings and developments. Photon. Res., 5, OM1-OM3(2017).
[6] T. J. Kippenberg, A. L. Gaeta, M. Lipson, M. L. Gorodetsky. Dissipative Kerr solitons in optical microresonators. Science, 361, eaan8083(2018).
[7] P. Del’Haye, A. Schliesser, O. Arcizet, T. Wilken, R. Holzwarth, T. Kippenberg. Optical frequency comb generation from a monolithic microresonator. Nature, 450, 1214-1217(2008).
[8] M.-G. Suh, Q.-F. Yang, K. Y. Yang, X. Yi, K. J. Vahala. Microresonator soliton dual-comb spectroscopy. Science, 354, 600-603(2016).
[9] Q.-F. Yang, B. Shen, H. Wang, M. Tran Anh, Z. Zhang, K. Y. Yang, L. Wu, C. Bao, J. Bowers, A. Yariv, K. Vahala. Vernier spectrometer using counterpropagating soliton microcombs. Science, 363, 965-968(2019).
[10] S. B. Papp, K. Beha, P. Del’Haye, F. Quinlan, H. Lee, K. J. Vahala, S. A. Diddams. Microresonator frequency comb optical clock. Optica, 1, 10-14(2014).
[11] Z. L. Newman, V. Maurice, T. Drake, J. R. Stone, T. C. Briles, D. T. Spencer, C. Fredrick, Q. Li, D. Westly, B. R. Ilic, B. Shen, M.-G. Suh, K. Y. Yang, C. Johnson, D. M. S. Johnson, L. Hollberg, K. J. Vahala, K. Srinivasan, S. A. Diddams, J. Kitching, S. B. Papp, M. T. Hummon. Architecture for the photonic integration of an optical atomic clock. Optica, 6, 680-685(2019).
[12] M.-G. Suh, X. Yi, Y.-H. Lai, S. Leifer, I. Grudinin, G. Vasisht, E. Martin, M. Fitzgerald, G. Doppmann, J. Wang, D. Mawet, S. Papp, S. Diddams, C. Beichman, K. Vahala. Searching for exoplanets using a microresonator astrocomb. Nat. Photonics, 13, 25-30(2019).
[13] E. Obrzud, M. Rainer, A. Harutyunyan, M. Anderson, M. Geiselmann, B. Chazelas, S. Kundermann, S. Lecomte, M. Cecconi, A. Ghedina, E. Molinari, F. Pepe, F. Wildi, F. Bouchy, T. Kippenberg, T. Herr. A microphotonic astrocomb. Nat. Photonics, 13, 31-35(2019).
[14] J. Pfeifle, V. Brasch, M. Lauermann, Y. Yu, D. Wegner, T. Herr, K. Hartinger, P. Schindler, J. Li, D. Hillerkuss, R. Schmogrow, C. Weimann, R. Holzwarth, W. Freude, J. Leuthold, T. Kippenberg, C. Koos. Coherent terabit communications with microresonator Kerr frequency combs. Nat. Photonics, 8, 375-380(2014).
[15] A. Fülöp, M. Mazur, A. Lorences-Riesgo, P.-H. Wang, Y. Xuan, D. Leaird, M. Qi, P. Andrekson, A. Weiner, V. Torres-Company. High-order coherent communications using mode-locked dark-pulse Kerr combs from microresonators. Nat. Commun., 9, 1598(2018).
[16] D. Spencer, T. Drake, T. Briles, J. Stone, L. Sinclair, C. Fredrick, Q. Li, D. Westly, B. Ilic, A. Bluestone, N. Volet, T. Komljenovic, L. Chang, S. H. Lee, D. Y. Oh, M.-G. Suh, K. Y. Yang, M. Pfeiffer, T. Kippenberg, S. Papp. An integrated-photonics optical-frequency synthesizer. Nature, 557, 81-85(2018).
[17] S.-W. Huang, J. Yang, M. Yu, B. McGuyer, D.-L. Kwong, T. Zelevinsky, C. Wong. A broadband chip-scale optical frequency synthesizer at 2.7×10⁻⁶ relative uncertainty. Sci. Adv., 2, e1501489(2016).
[18] M.-G. Suh, K. J. Vahala. Soliton microcomb range measurement. Science, 359, 884-887(2018).
[19] J. Riemensberger, A. Lukashchuk, M. Karpov, W. Weng, E. Lucas, J. Liu, T. J. Kippenberg. Massively parallel coherent laser ranging using a soliton microcomb. Nature, 581, 164-170(2020).
[20] J. Wang, Z. Lu, W. Weiqiang, F. Zhang, J. Chen, Y. Wang, J. Zheng, S. Chu, W. Zhao, B. Little, X. Qu, W. Zhang. Long-distance ranging with high precision using a soliton microcomb. Photon. Res., 8, 1964-1972(2020).
[21] J. Feldmann, N. Youngblood, M. Karpov, H. Gehring, X. Li, M. Stappers, M. Gallo, X. Fu, A. Lukashchuk, A. Raja, J. Liu, D. Wright, A. Sebastian, T. Kippenberg, W. Pernice, H. Bhaskaran. Parallel convolutional processing using an integrated photonic tensor core. Nature, 589, 52-58(2021).
[22] X. Xu, M. Tan, B. Corcoran, J. Wu, A. Boes, T. Nguyen, S. Chu, B. Little, D. Hicks, R. Morandotti, A. Mitchell, D. Moss. 11 tops photonic convolutional accelerator for optical neural networks. Nature, 589, 44-51(2021).
[23] J. Wang, Y. Guo, H. Liu, L. C. Kimerling, J. Michel, A. M. Agarwal, G. Li, L. Zhang. Robust cavity soliton formation with hybrid dispersion. Photon. Res., 6, 647-651(2018).
[24] H. Weng, J. Liu, A. A. Afridi, J. Li, J. Dai, X. Ma, Y. Zhang, Q. Lu, J. F. Donegan, W. Guo. Directly accessing octave-spanning dissipative Kerr soliton frequency combs in an AlN microresonator. Photon. Res., 9, 1351-1357(2021).
[25] J. Gu, J. Liu, Z. Bai, H. Wang, X. Cheng, G. Li, M. Zhang, X. Li, Q. Shi, M. Xiao, X. Jiang. Dry-etched ultrahigh-
[26] X. Zhang, H. Luo, W. Xiong, X. Chen, X. Han, G. Xiao, H. Feng. Numerical investigation of turnkey soliton generation in an organically coated microresonator. Phys. Rev. A, 103, 023515(2021).
[27] X. Wang, P. Xie, W. Wang, Y. Wang, Z. Lu, L. Wang, S. T. Chu, B. E. Little, W. Zhao, W. Zhang. Program-controlled single soliton microcomb source. Photon. Res., 9, 66-72(2021).
[28] W. Liang, A. A. Savchenkov, V. S. Ilchenko, D. Eliyahu, D. Seidel, A. B. Matsko, L. Maleki. Generation of a coherent near-infrared Kerr frequency comb in a monolithic microresonator with normal GVD. Opt. Lett., 39, 2920-2923(2014).
[29] X. Xue, M. Qi, A. M. Weiner. Normal-dispersion microresonator Kerr frequency combs. Nanophotonics, 5, 244-262(2016).
[30] G. Lin, Y. K. Chembo. Phase-locking transition in Raman combs generated with whispering gallery mode resonators. Opt. Lett., 41, 3718-3721(2016).
[31] G. Lin, S. Diallo, J. M. Dudley, Y. K. Chembo. Universal nonlinear scattering in ultra-high Q whispering gallery-mode resonators. Opt. Express, 24, 14880-14894(2016).
[32] W. Jin, Q.-F. Yang, L. Chang, B. Shen, H. Wang, M. Leal, L. Wu, M. Gao, A. Feshali, M. Paniccia, K. Vahala, J. Bowers. Hertz-linewidth semiconductor lasers using CMOS-ready ultra-high-
[33] H.-J. Chen, Q.-X. Ji, H. Wang, Q.-F. Yang, Q.-T. Cao, Q. Gong, X. Yi. Chaos-assisted two-octave-spanning microcombs. Nat. Commun., 11, 2336(2020).
[34] Q.-F. Yang, X. Yi, K. Y. Yang, K. Vahala. Spatial-mode-interaction-induced dispersive waves and their active tuning in microresonators. Optica, 3, 1132-1135(2016).
[35] X. Yi, Q.-F. Yang, X. Zhang, K. Y. Yang, K. Vahala. Single-mode dispersive waves and soliton microcomb dynamics. Nat. Commun., 8, 14869(2016).
[36] C. Reimer, M. Kues, P. Roztocki, B. Wetzel, F. Grazioso, B. Little, S. Chu, T. Johnston, Y. Bromberg, L. Caspani, D. Moss, R. Morandotti. Generation of multiphoton entangled quantum states by means of integrated frequency combs. Science, 351, 1176-1180(2016).
[37] M. Kues, C. Reimer, P. Roztocki, L. Romero Cortés, S. Sciara, B. Wetzel, Y. Zhang, A. Cino, S. Chu, B. Little, D. Moss, L. Caspani, J. Azaña, R. Morandotti. On-chip generation of high-dimensional entangled quantum states and their coherent control. Nature, 546, 622-626(2017).
[38] J. Riemensberger, K. Hartinger, T. Herr, V. Brasch, R. Holzwarth, T. J. Kippenberg. Dispersion engineering of thick high-
[39] W. C. Jiang, J. Zhang, N. G. Usechak, Q. Lin. Dispersion engineering of high-
[40] A. Eshaghian, D. Timucin, K. Thyagarajan, T. Wunderer, N. Johnson, D. Schwartz. Advanced dispersion engineering of a III-nitride micro-resonator for a blue frequency comb. Opt. Express, 28, 30542-30554(2020).
[41] Y. Okawachi, K. Saha, J. Levy, Y. Wen, M. Lipson, A. Gaeta. Octave-spanning frequency comb generation in a silicon nitride chip. Opt. Lett., 36, 3398-3400(2011).
[42] S. Kim, K. Han, C. Wang, J. Jaramillo-Villegas, X. Xue, C. Bao, Y. Xuan, D. Leaird, A. Weiner, M. Qi. Dispersion engineering and frequency comb generation in thin silicon nitride concentric microresonators. Nat. Commun., 8, 372(2017).
[43] K. Y. Yang, K. Beha, D. Cole, X. Yi, P. Del’Haye, H. Lee, J. Li, D. Y. Oh, S. Diddams, S. Papp, K. Vahala. Broadband dispersion-engineered microresonator on a chip. Nat. Photonics, 10, 316-320(2016).
[44] I. Grudinin, N. Yu. Dispersion engineering of crystalline resonators via microstructuring. Optica, 2, 221-224(2015).
[45] S. Fujii, Y. Hayama, K. Imamura, H. Kumazaki, Y. Kakinuma, T. Tanabe. All-precision-machining fabrication of ultrahigh-
[46] S. Fujii, T. Tanabe. Dispersion engineering and measurement of whispering gallery mode microresonator for Kerr frequency comb generation. Nanophotonics, 9, 1087-1104(2020).
[47] P. Del’Haye, O. Arcizet, M. Gorodetsky, R. Holzwarth, T. Kippenberg. Frequency comb assisted diode laser spectroscopy for measurement of microcavity dispersion. Nat. Photonics, 3, 529-533(2009).
[48] M. J. Thorpe, R. J. Jones, K. D. Moll, J. Ye, R. Lalezari. Precise measurements of optical cavity dispersion and mirror coating properties via femtosecond combs. Opt. Express, 13, 882-888(2005).
[49] S. Fujii, S. Tanaka, M. Fuchida, H. Amano, Y. Hayama, R. Suzuki, Y. Kakinuma, T. Tanabe. Octave-wide phase-matched four-wave mixing in dispersion-engineered crystalline microresonators. Opt. Lett., 44, 3146-3149(2019).
[50] G. Lin, J. Fürst, D. V. Strekalov, I. S. Grudinin, N. Yu. High-
[51] J. Li, H. Lee, K. Y. Yang, K. Vahala. Sideband spectroscopy and dispersion measurement in microcavities. Opt. Express, 20, 26337-26344(2012).
[52] X. Yi, Q.-F. Yang, K. Y. Yang, M.-G. Suh, K. Vahala. Soliton frequency comb at microwave rates in a high-
[53] H. Lee, T. Chen, J. Li, K. Y. Yang, S. Jeon, O. Painter, K. J. Vahala. Chemically etched ultrahigh-
[54] H. Zhou, Y. Geng, W. Cui, S.-W. Huang, Q. Zhou, K. Qiu, C. Wong. Soliton bursts and deterministic dissipative Kerr soliton generation in auxiliary-assisted microcavities. Light Sci. Appl., 8, 50(2019).
[55] T. Herr, V. Brasch, J. Jost, C. Wang, N. Kondratiev, M. Gorodetsky, T. Kippenberg. Temporal solitons in optical microresonators. Nat. Photonics, 8, 145-152(2012).
[56] L. He, Y. Xiao, C. Dong, J. Zhu, V. Gaddam, L. Yang. Compensation of thermal refraction effect in high-
[57] M. J. Weber. Handbook of Optical Materials(2003).
[58] G. Lin, Y. Chembo. On the dispersion management of fluorite whispering-gallery mode resonators for Kerr optical frequency comb generation in the telecom and mid-infrared range. Opt. Express, 23, 1594-1604(2015).
[59] T. Herr, V. Brasch, J. D. Jost, I. Mirgorodskiy, G. Lihachev, M. L. Gorodetsky, T. J. Kippenberg. Mode spectrum and temporal soliton formation in optical microresonators. Phys. Rev. Lett., 113, 123901(2014).
[60] A. Kordts, M. H. Pfeiffer, H. Guo, V. Brasch, T. J. Kippenberg. Higher order mode suppression in high-
[61] I. S. Grudinin, V. Huet, N. Yu, A. B. Matsko, M. L. Gorodetsky, L. Maleki. High-contrast Kerr frequency combs. Optica, 4, 434-437(2017).


Set citation alerts for the article
Please enter your email address

© Copyright 2018-2021 | Chinese Laser Press. All Rights Reserved 沪ICP备15018463号-20