
Yuanhong Mao, Zhong Ma, Zhanzhuang He. Infrared-visible image patches matching via convolutional neural networks[J]. Infrared and Laser Engineering, 2021, 50(5): 20200364
- Infrared and Laser Engineering
- Vol. 50, Issue 5, 20200364 (2021)
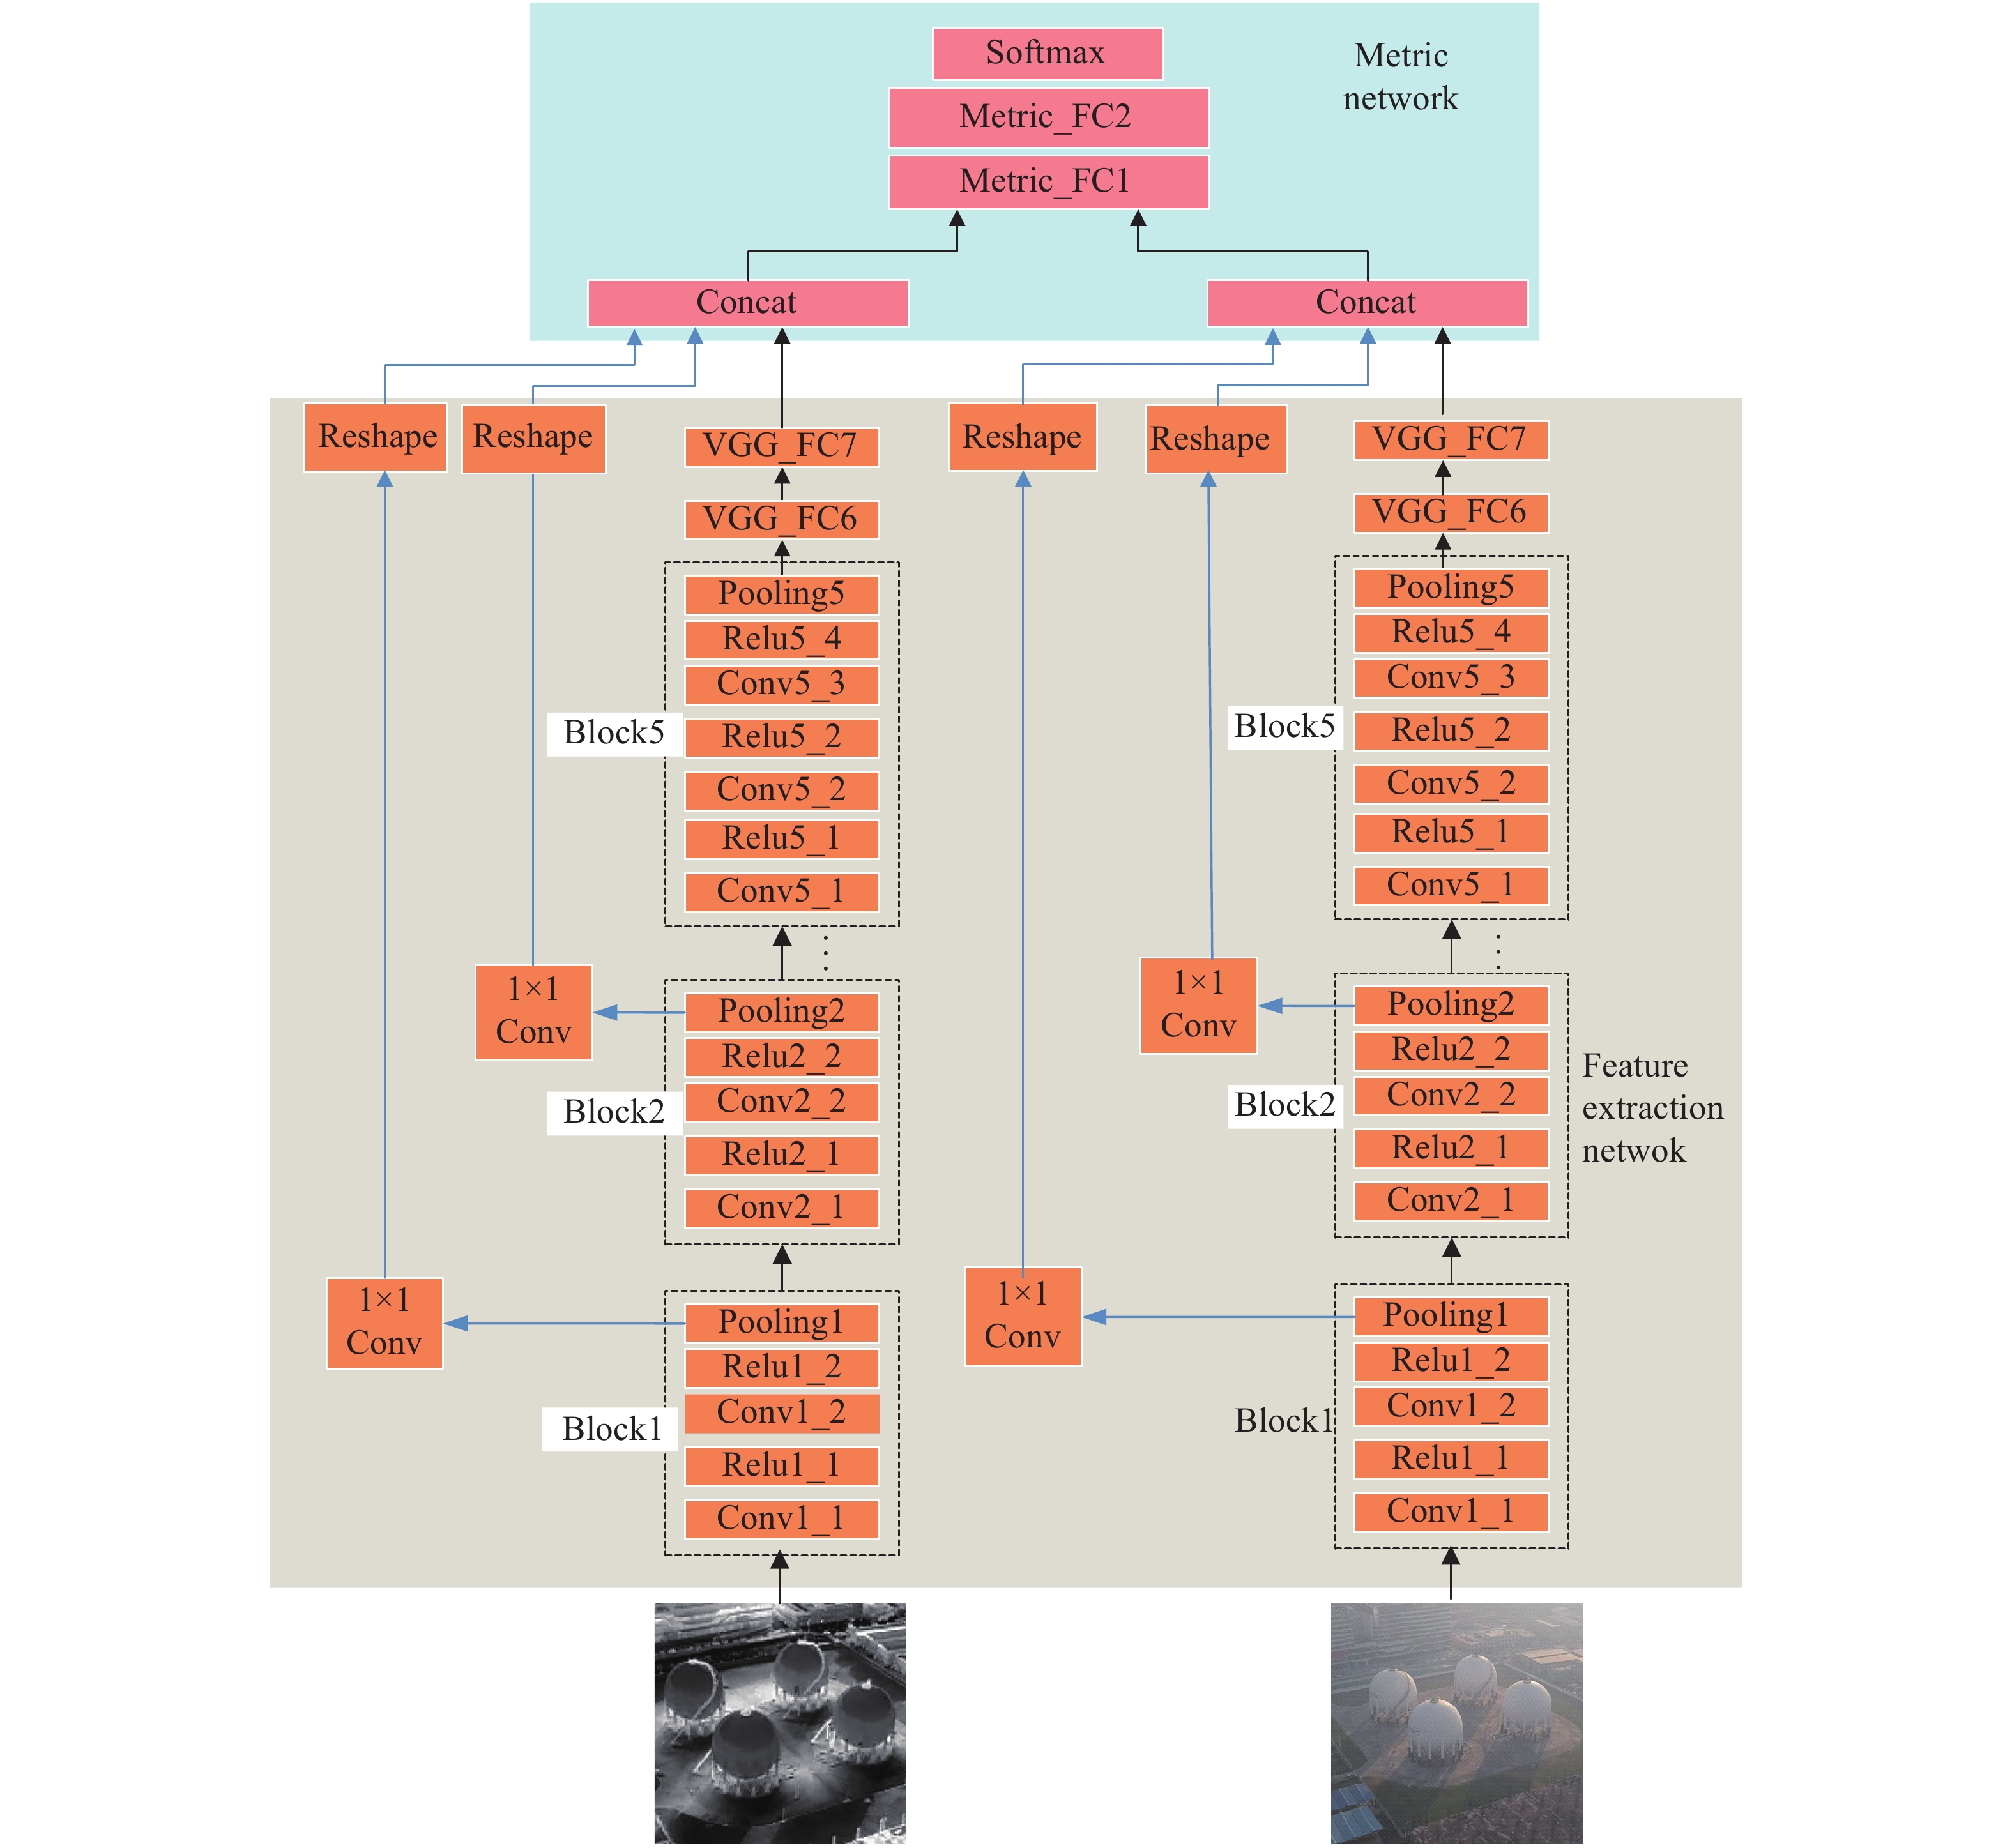
Fig. 1. Infrared-visible image deep matching network. The black line with the arrow indicates the data-flow. The blue lines represent shortcut connections through the reshape layers. This figure describes the process of the infrared-visible image patches matching
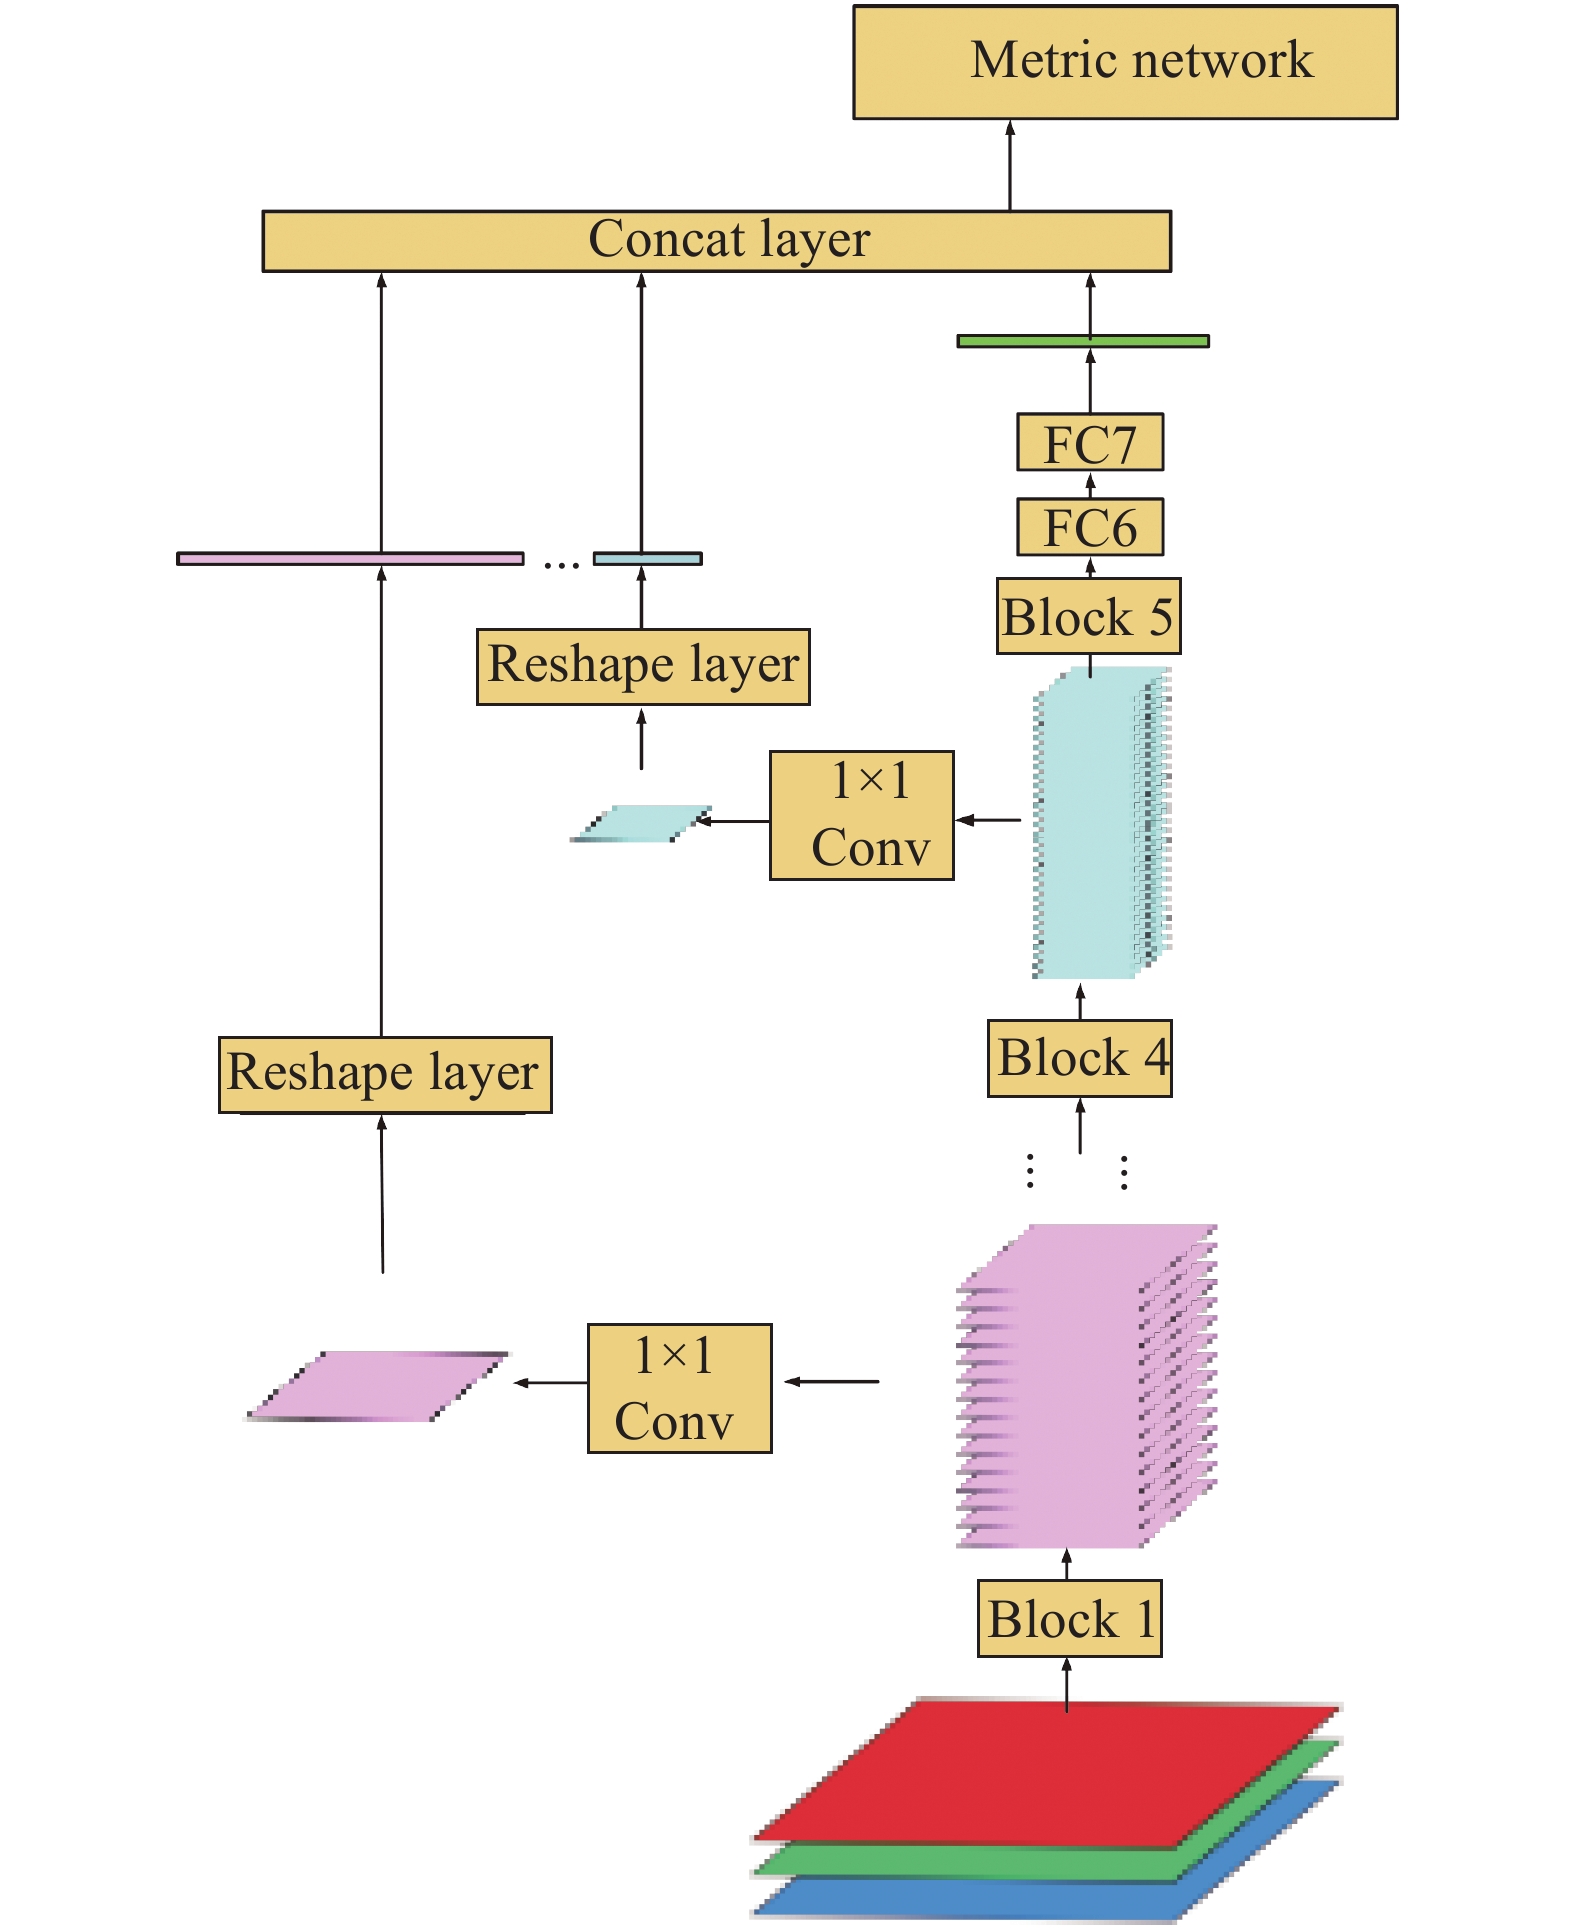
Fig. 2. Multi-scale spatial feature integration in a single branch. The output feature map in each block shorts to the concatenation layer. The output of the concatenation layer is one input of the metric network
Fig. 3. (a) Feature extraction network architecture with the contrastive loss; (b) Input data for feature extraction network with the contrastive loss. The visual patches are in the first row. The infrared patches are in the second row. The positive samples are in odd columns. The negative ones are in even columns
Fig. 4. (a) Feature extraction network architecture with the triplet loss; (b) Input data for feature extraction network with the triplet loss. The anchor patches are in the first row. The positive patches are in the second row. The negative patches are in the third row. Each column is triple patches input
Fig. 5. Infrared-visible image samples. Ten image pairs randomly was selected. The ground truth of the first five images is 0. The ground truth of the last five columns is 1
Fig. 6. ROC curves for various methods. The numbers in the legends are FPR95 values. In the legend, the symbol “F” means the network uses fine-tuning with VGG16. The symbol “C” means that the contrastive loss is used in the extraction feature network. The symbol “T” means that the triplet loss is used in the extraction feature network. The symbol “S” means that shortcut connection is used
Fig. 7. Visualization of the five class features in the test data set by the feature extraction network. (a) Features from the original network; (b) Features from the network with the contrastive loss; (c) Features from the network with the triplet loss
Fig. 8. Top-ranking false and true results in overpass and factory image patches. (a) True positive samples; (b) True negative samples; (c) False positive samples; (d) False negative samples
Fig. 9. Performance matching in the test data set. In the legend, the symbols “F”, “C”, “T” and “S” have the same meaning in Fig. 6

Set citation alerts for the article
Please enter your email address
© Copyright 2018-2021 | Chinese Laser Press. All Rights Reserved 沪ICP备15018463号-20