• Laser & Optoelectronics Progress
  • Vol. 57, Issue 22, 221106 (2020)
Yican Chen, Xia Wu*, Zhi Luo, Huidong Yang, and Bo Huang*
Author Affiliations
  • College of Information Science and Technology, Jinan University, Guangzhou, Guangdong 510632, China
  • show less
    DOI: 10.3788/LOP57.221106 Cite this Article Set citation alerts
    Yican Chen, Xia Wu, Zhi Luo, Huidong Yang, Bo Huang. Fourier Ptychographic Microscopy Reconstruction Based on Deep Learning[J]. Laser & Optoelectronics Progress, 2020, 57(22): 221106 Copy Citation Text show less
    Diagram of a typical FPM system
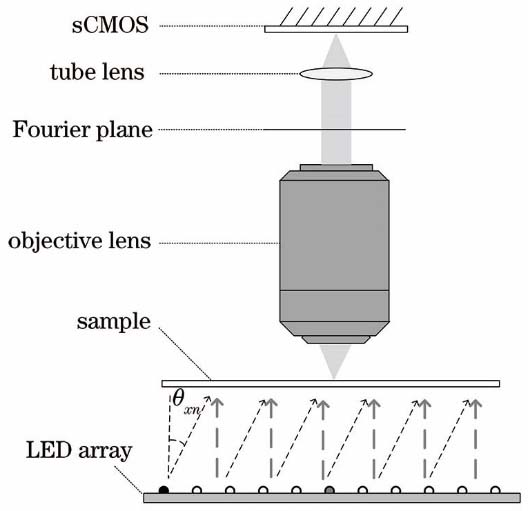
    Fig. 1. Diagram of a typical FPM system
    Examples of 7 × 7 low-resolution images acquired by FPM. (a) Original image; (b) Fourier spectrogram; (c) low-resolution image; (d) images observed by LEDs in different positions
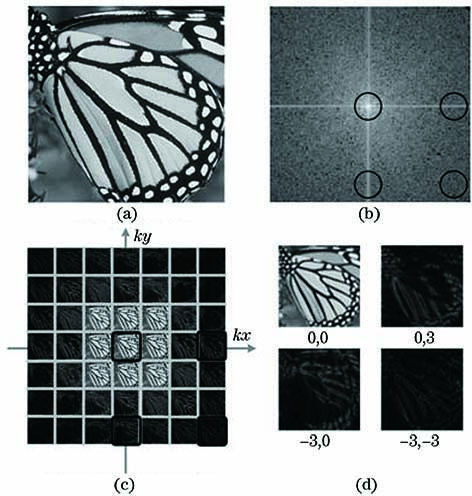
    Fig. 2. Examples of 7 × 7 low-resolution images acquired by FPM. (a) Original image; (b) Fourier spectrogram; (c) low-resolution image; (d) images observed by LEDs in different positions
    Structure diagram of proposed Fourier stacked microscopy imaging network model
    Fig. 3. Structure diagram of proposed Fourier stacked microscopy imaging network model
    Convolution module
    Fig. 4. Convolution module
    Upsampling reconstruction module
    Fig. 5. Upsampling reconstruction module
    Residual dense module with channel attention mechanism
    Fig. 6. Residual dense module with channel attention mechanism
    Channel attention module
    Fig. 7. Channel attention module
    Example graph for building and using training datasets
    Fig. 8. Example graph for building and using training datasets
    Schematic of three LED lighting modes. (a) Turn on all LEDs; (b) turn on bright-field area LEDs; (c) turn on rhombus area LEDs
    Fig. 9. Schematic of three LED lighting modes. (a) Turn on all LEDs; (b) turn on bright-field area LEDs; (c) turn on rhombus area LEDs
    Convergence analysis of FPRDCA with different values of N, I, and G and three sampling patterns. (a) N; (b) I; (c) G; (d) three sampling patterns
    Fig. 10. Convergence analysis of FPRDCA with different values of N, I, and G and three sampling patterns. (a) N; (b) I; (c) G; (d) three sampling patterns
    Convergence analysis of FPRDCA, FPRD, and PtychNet
    Fig. 11. Convergence analysis of FPRDCA, FPRD, and PtychNet
    Test results of each method on the dataset
    Fig. 12. Test results of each method on the dataset
    MethodSet5Set14Urban100Manga109B100
    PSNR /dBSSIMPSNR /dBSSIMPSNR /dBSSIMPSNR /dBSSIMPSNR /dBSSIM
    PtychNet25.330.808824.320.720922.460.675223.360.796623.580.6605
    AP30.190.912428.360.842426.090.825329.640.901227.030.8227
    BF-929.050.870326.750.762824.760.728627.860.867624.870.6869
    14-4-6433.170.933929.870.858228.070.846332.220.936628.010.8309
    8-8-6433.210.935529.940.852428.060.839932.230.929528.020.8250
    20-8-6433.570.936129.970.869328.180.847632.380.938028.160.8402
    *14-8-6433.180.935129.860.859627.990.837932.160.928227.880.8312
    Rhombus33.160.935429.830.857728.070.846032.050.936927.870.8283
    14-8-1633.020.931929.800.858127.940.834931.940.924727.930.8304
    14-8-3233.330.935429.910.861528.100.839832.260.928528.090.8306
    14-8-6433.460.935429.970.860228.190.848632.270.938428.110.8319
    Table 1. Average PSNR and SSIM of each model on 5 benchmark datasets
    MethodAPPtychNet14-8-648-8-6420-8-6414-8-3214-4-6414-8-16
    Time /ms73020.144.430.251.743.428.839.6
    Table 2. Average running time for reconstructing a single 128 × 128 image with different models based on 5 benchmark datasets
    Yican Chen, Xia Wu, Zhi Luo, Huidong Yang, Bo Huang. Fourier Ptychographic Microscopy Reconstruction Based on Deep Learning[J]. Laser & Optoelectronics Progress, 2020, 57(22): 221106
    Download Citation