
Hong Zhang, Yunyang Yan, Yian Liu, Shangbing Gao. Fire Detection Method Based on Localization Confidence and Region-Based Fully Convolutional Network[J]. Laser & Optoelectronics Progress, 2020, 57(20): 201021
- Laser & Optoelectronics Progress
- Vol. 57, Issue 20, 201021 (2020)
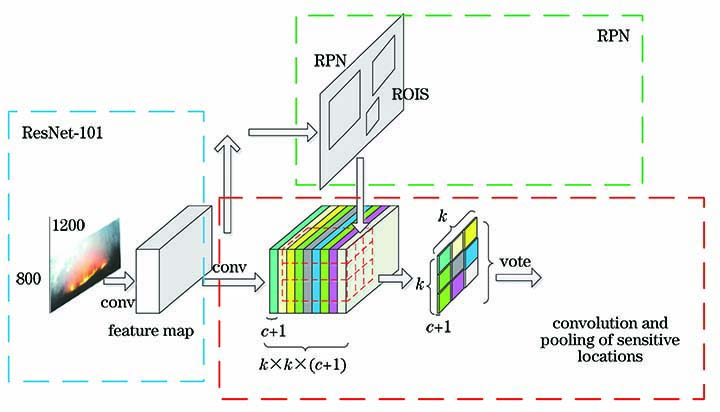
Fig. 1. Detection diagram of R-FCN
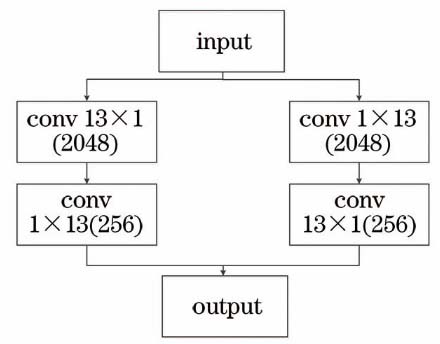
Fig. 2. Separable convolution
Fig. 3. Incomplete information marked by anchors
Fig. 4. Change of translation and scaling
Fig. 5. Comparison of iterations accuracy changes[11]. (a)FPN iterations accuracy changes; (b)R-CNN iterations accuracy changes
Fig. 6. Comparison of pooling. (a) ROI pooling; (b) precise ROI pooling
Fig. 7. Non-maximum suppression
Fig. 8. Lack of localization confidence of NMS
Fig. 9. Prediction of IOU
Fig. 10. Flow chart of LOF-FCN
Fig. 11. Comparison of fire missed detection rate
Fig. 12. Comparison of fire detection accuracy
Fig. 13. Experimental video. (a) Video 1; (b) video 2; (c) video 3; (d) video 4; (e) video 5; (f) video 6
|
Table 1. Comparison of the speed of the detection
|
Table 2. Training data
|
Table 3. Comparison of algorithm performance
| ||||||||||||||||||||||||||||||||||||||||||||||||||||||||||||||||||||||||||
Table 4. Detection results of flame
| ||||||||||||||||||||||||||||||||||||||||||||||||||||
Table 5. Detection results of non-flame

Set citation alerts for the article
Please enter your email address
© Copyright 2018-2021 | Chinese Laser Press. All Rights Reserved 沪ICP备15018463号-20