Lei Xu1、2, Mohsen Rahmani2、3、4、*, Yixuan Ma1, Daria A. Smirnova3, Khosro Zangeneh Kamali3、4, Fu Deng1, Yan Kei Chiang1, Lujun Huang1, Haoyang Zhang5, Stephen Gould6, Dragomir N. Neshev3、4, and Andrey E. Miroshnichenko1、*
Author Affiliations
1University of New South Wales, School of Engineering and Information Technology, Canberra, Australia2Nottingham Trent University, School of Science & Technology, Department of Engineering, Advanced Optics and Photonics Laboratory, Nottingham, United Kingdom3Australian National University, Research School of Physics, Nonlinear Physics Centre, Canberra, Australia4Australian National University, Research School of Physics, ARC Centre of Excellence for Transformative Meta-Optical Systems (TMOS), Canberra, Australia5Queensland University of Technology, School of Electrical Engineering and Computer Science, Brisbane, Queensland, Australia6Australian National University, College of Engineering and Computer Science, Canberra, Australiashow less
DOI: 10.1117/1.AP.2.2.026003
Cite this Article
Set citation alerts
Lei Xu, Mohsen Rahmani, Yixuan Ma, Daria A. Smirnova, Khosro Zangeneh Kamali, Fu Deng, Yan Kei Chiang, Lujun Huang, Haoyang Zhang, Stephen Gould, Dragomir N. Neshev, Andrey E. Miroshnichenko. Enhanced light–matter interactions in dielectric nanostructures via machine-learning approach[J]. Advanced Photonics, 2020, 2(2): 026003
Copy Citation Text
show less
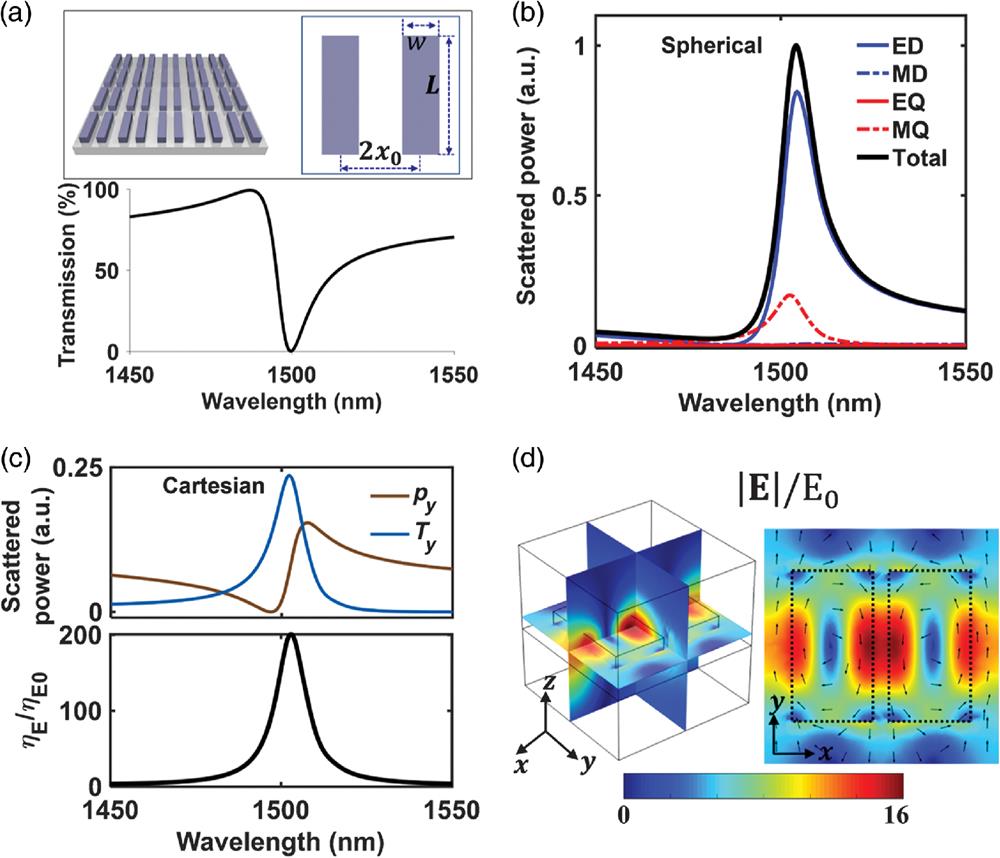
Fig. 1. (a) Top: (top left) Schematics of the silicon nanobars metasurface and (top right) its unit cell. Bottom: Calculated transmission spectrum of the metasurface with structural parameters , , . (b) Spherical multipolar structure of the metasurface. (c) Top: Cartesian ED and TD modes excitations. Bottom: The electric energy enhancement . It is defined as the electric energy inside the two nanobars normalized by the electric energy within the same volume of the nanobars for the pump field. (d) Electric near-field distributions at the resonance. Left: 3-D view. Right: top view.
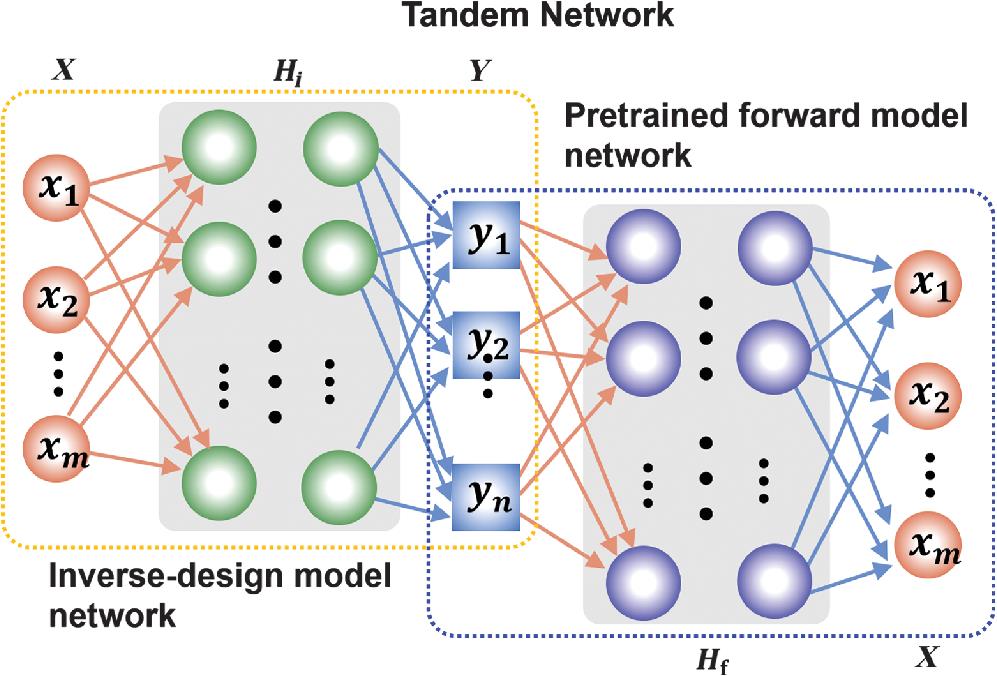
Fig. 2. The architecture of the TN model, which consists of an inverse-design network connected to a pretrained forward model network. represents the input and output, which is the transmission spectra data in our case, and represents the output in the middle layer which is the structural parameters here.
Fig. 3. (a) Evolution of the training loss for the forward model network. (b) Comparison of the NN approximation to the real transmission spectrum. (c) Evolution of the training loss for the inverse-design model network. (d) Comparison of the spectra between the NN approximation and the input based on Eq. (2).
Fig. 4. Inverse design of Si nanobar metasurfaces with Fano-shape transmission spectra. (a)–(c) , 1500, and 1550 nm, respectively. , . (d)–(f) , , , 0.5, and 0.7, respectively. (g)–(i) , , 15, and 25 nm, respectively, .
Fig. 5. (a) SEM image of the fabricated sample with designed resonance at 1500 nm. (b) Experimentally measured linear spectra. (c) Experimentally measured THG spectra of the samples.
Fig. 6. (a)–(c) Optomechanic vibration under the -polarized pump. (a) Displacement of the nanobars after 1 ns. (b) The transient displacement and . (c) Spectral densities of displacement and . (d)–(f) Optomechanical vibration under the -polarized pump. (d) Displacement of the nanobars after 1 ns. (e) The transient displacement and . (f) Spectral densities of displacement and .
Fig. 7. The spectral density of in the (a) and (b) directions for different laser pump wavelengths.