• Photonics Research
  • Vol. 12, Issue 3, 431 (2024)
Josep Martínez-Romeu1、†, Iago Diez1、†, Sebastian Golat2, Francisco J. Rodríguez-Fortuño2, and Alejandro Martínez1、*
Author Affiliations
  • 1Nanophotonics Technology Center, Universitat Politècnica de València, Valencia 46022, Spain
  • 2Department of Physics, King’s College London, London WC2R 2LS, UK
  • show less
    DOI: 10.1364/PRJ.509634 Cite this Article Set citation alerts
    Josep Martínez-Romeu, Iago Diez, Sebastian Golat, Francisco J. Rodríguez-Fortuño, Alejandro Martínez. Chiral forces in longitudinally invariant dielectric photonic waveguides[J]. Photonics Research, 2024, 12(3): 431 Copy Citation Text show less
    (a) Schematic showing the combined action of the translation of the cloud of enantiomers due to the optical force (dopt) and the increase in the cloud size due to Brownian motion (dB). After a sorting time (tsort), the clouds are separated by a distance of Δx. Schematic adapted from Ref. [28]. (b) Sorting time of the enantiomer clouds as a function of the modulus of the separating optical force. Particles of different radii display different sorting time curves, from 1 to 1000 nm.
    Fig. 1. (a) Schematic showing the combined action of the translation of the cloud of enantiomers due to the optical force (dopt) and the increase in the cloud size due to Brownian motion (dB). After a sorting time (tsort), the clouds are separated by a distance of Δx. Schematic adapted from Ref. [28]. (b) Sorting time of the enantiomer clouds as a function of the modulus of the separating optical force. Particles of different radii display different sorting time curves, from 1 to 1000 nm.
    (a) Schematic of the waveguide cross-section representing the opposite action of the total optical force exerted by the guided mode (in red) onto particles with opposed chirality. (b) Transversal electric field intensity (in color map) and polarization (in arrow or ellipse map) of the quasi-TE mode and of the quasi-CP mode. The handedness of the polarization ellipses does not change its sign throughout the cross-section. (c) Net chiral and achiral force along the x–direction that a quasi-TE mode in a SiN strip waveguide exerts on a particle, depending on its size. This is calculated for three different SiN waveguides, each one operating at a different wavelength: 405 nm, 780 nm, or 1310 nm. The SiN cross-section sizes (width×thickness) of the waveguides are: 0.151 μm×0.139 μm (for λ=405 nm), 0.292 μm×0.268 μm (for λ=780 nm), and 0.495 μm×0.45 μm (for λ=1310 nm). (d) Net transversal chiral and achiral forces that a quasi-CP mode in a strip waveguide exerts on a particle depending on the particle size. (e) Cross-section of the strip waveguide showing the position where the forces are evaluated for (c) and (d): at a vertical distance over the top of the waveguide equal to the radius of the particle, and at a horizontal distance equal to the fourth of the waveguide width from the center of the waveguide. The calculated forces are expected to be more accurate for particles whose size is smaller than the wavelength. This upper bound is ∼150 nm, 290 nm, and 490 nm for λ=405 nm, 780 nm, and 1310 nm, respectively.
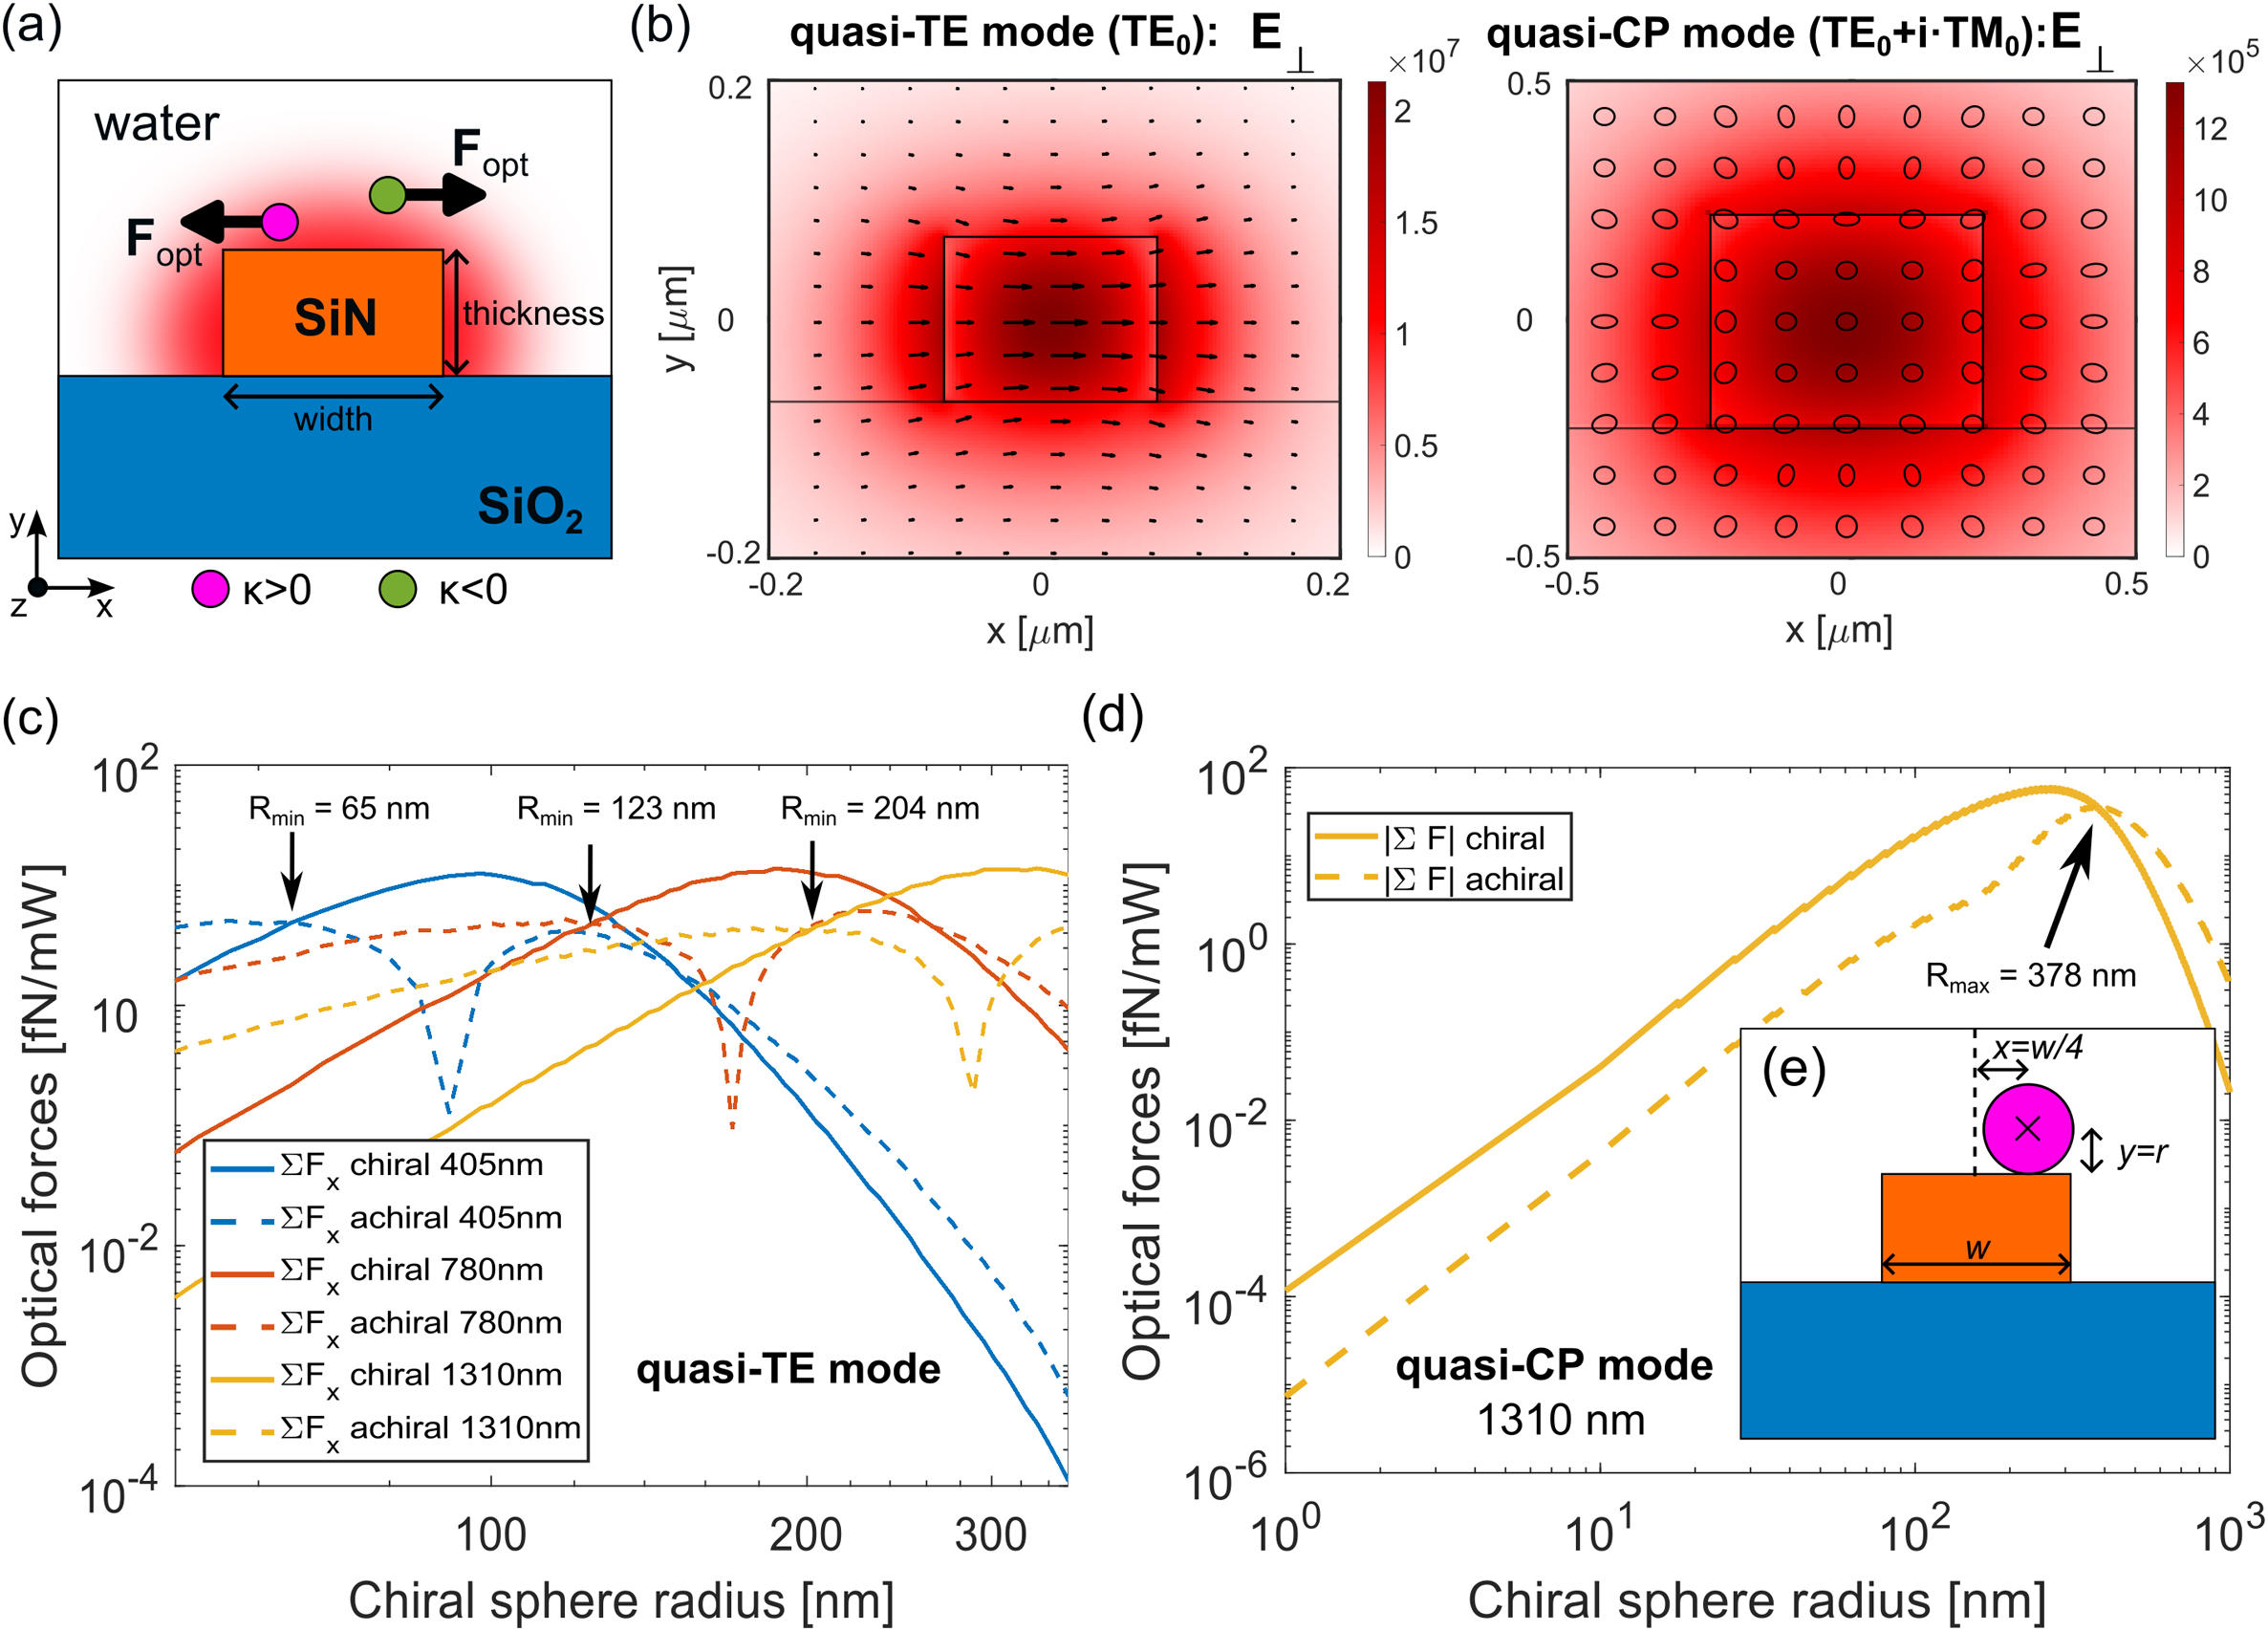
    Fig. 2. (a) Schematic of the waveguide cross-section representing the opposite action of the total optical force exerted by the guided mode (in red) onto particles with opposed chirality. (b) Transversal electric field intensity (in color map) and polarization (in arrow or ellipse map) of the quasi-TE mode and of the quasi-CP mode. The handedness of the polarization ellipses does not change its sign throughout the cross-section. (c) Net chiral and achiral force along the x–direction that a quasi-TE mode in a SiN strip waveguide exerts on a particle, depending on its size. This is calculated for three different SiN waveguides, each one operating at a different wavelength: 405 nm, 780 nm, or 1310 nm. The SiN cross-section sizes (width×thickness) of the waveguides are: 0.151  μm×0.139  μm (for λ=405  nm), 0.292  μm×0.268  μm (for λ=780  nm), and 0.495  μm×0.45  μm (for λ=1310  nm). (d) Net transversal chiral and achiral forces that a quasi-CP mode in a strip waveguide exerts on a particle depending on the particle size. (e) Cross-section of the strip waveguide showing the position where the forces are evaluated for (c) and (d): at a vertical distance over the top of the waveguide equal to the radius of the particle, and at a horizontal distance equal to the fourth of the waveguide width from the center of the waveguide. The calculated forces are expected to be more accurate for particles whose size is smaller than the wavelength. This upper bound is 150  nm, 290 nm, and 490 nm for λ=405  nm, 780 nm, and 1310 nm, respectively.
    Field properties (We, Wm, and Sm) that generate the dominant forces of the quasi-TE mode in a strip waveguide (0.151 μm wide×0.139 μm thick) at λ=405 nm. The force stemming from the Sm as well as the total optical force is represented for both chiralities of the particle (κ=±0.5). All forces are calculated for a particle of 80 nm radius. The axes of all graphs refer to the x– and y–coordinates measured in μm units. The arrow map represents the transversal components of the vectorial quantities being plotted, and the colormap represents the scalar quantity or the z–component of the vectorial quantity being plotted. The particle tracking graph shows the last position of 500 particles per enantiomer inside the microchannel (3 μm wide×0.35 μm thick) after 2 s of motion given the total optical force field produced by the waveguide. The initial x–coordinate of each particle was uniformly randomized between −0.5 and 0.5 μm, and the initial y–coordinate was uniformly randomized with any value within the microchannel. The orange circle represents the particle size to scale, whereas the magenta and green dots represent the center of mass of the enantiomeric particles.
    Fig. 3. Field properties (We, Wm, and Sm) that generate the dominant forces of the quasi-TE mode in a strip waveguide (0.151  μmwide×0.139  μmthick) at λ=405  nm. The force stemming from the Sm as well as the total optical force is represented for both chiralities of the particle (κ=±0.5). All forces are calculated for a particle of 80 nm radius. The axes of all graphs refer to the x– and y–coordinates measured in μm units. The arrow map represents the transversal components of the vectorial quantities being plotted, and the colormap represents the scalar quantity or the z–component of the vectorial quantity being plotted. The particle tracking graph shows the last position of 500 particles per enantiomer inside the microchannel (3  μmwide×0.35  μmthick) after 2 s of motion given the total optical force field produced by the waveguide. The initial x–coordinate of each particle was uniformly randomized between 0.5 and 0.5 μm, and the initial y–coordinate was uniformly randomized with any value within the microchannel. The orange circle represents the particle size to scale, whereas the magenta and green dots represent the center of mass of the enantiomeric particles.
    Total optical force (transversal in arrow map, and longitudinal in colormap) that a quasi-TE mode in a wide strip waveguide (2.270 μm wide×0.139 μm thick) at λ=405 nm exerts on an 80 nm radius particle is shown for both chiralities of particle κ±0.5. The particle tracking graph shows the last position of 500 particles per enantiomer inside the microchannel (3 μm wide×0.35 μm thick) after 2 s of motion given the total optical force field shown in the same figure. The initial x–coordinate of each particle was uniformly randomized between −0.5 and 0.5 μm, and the initial y–coordinate was uniformly randomized with any value within the microchannel. The orange circle represents the particle size to scale, whereas the magenta and green dots represent the center of mass of the enantiomeric particles.
    Fig. 4. Total optical force (transversal in arrow map, and longitudinal in colormap) that a quasi-TE mode in a wide strip waveguide (2.270  μmwide×0.139  μmthick) at λ=405  nm exerts on an 80 nm radius particle is shown for both chiralities of particle κ±0.5. The particle tracking graph shows the last position of 500 particles per enantiomer inside the microchannel (3  μmwide×0.35  μmthick) after 2 s of motion given the total optical force field shown in the same figure. The initial x–coordinate of each particle was uniformly randomized between 0.5 and 0.5 μm, and the initial y–coordinate was uniformly randomized with any value within the microchannel. The orange circle represents the particle size to scale, whereas the magenta and green dots represent the center of mass of the enantiomeric particles.
    Field properties (We,Wm and G) that generate the dominant forces of the quasi-CP mode in a strip waveguide (0.495 μm wide×0.450 μm thick). The force stemming from the gradient of G as well as the total force is represented for both chiralities of the particle (κ=±0.5). All forces are calculated for a particle of 52 nm radius. The arrow map represents the transversal components of the vectorial quantities being plotted, and the colormap represents the scalar quantity or the z–component of the vectorial quantity being plotted. The particle tracking graph shows the last position of 500 particles per enantiomer inside the microchannel (1.5 μm wide×1 μm thick) after 2 s of motion given the total optical force field produced by the waveguide. The initial x–coordinate of each particle was uniformly randomized between −0.5 and 0.5 μm, and the initial y–coordinate was uniformly randomized with any value within the microchannel. The orange circle represents the particle size to scale, whereas the magenta and green dots represent the center of mass of the enantiomeric particles.
    Fig. 5. Field properties (We,Wm and G) that generate the dominant forces of the quasi-CP mode in a strip waveguide (0.495  μmwide×0.450  μmthick). The force stemming from the gradient of G as well as the total force is represented for both chiralities of the particle (κ=±0.5). All forces are calculated for a particle of 52 nm radius. The arrow map represents the transversal components of the vectorial quantities being plotted, and the colormap represents the scalar quantity or the z–component of the vectorial quantity being plotted. The particle tracking graph shows the last position of 500 particles per enantiomer inside the microchannel (1.5  μmwide×1  μmthick) after 2 s of motion given the total optical force field produced by the waveguide. The initial x–coordinate of each particle was uniformly randomized between 0.5 and 0.5 μm, and the initial y–coordinate was uniformly randomized with any value within the microchannel. The orange circle represents the particle size to scale, whereas the magenta and green dots represent the center of mass of the enantiomeric particles.
    Net chiral and achiral forces exerted on a particle depending on its chirality parameter κ for (a) quasi-TE mode (λ=405 nm) along the x–direction and particle size r=80 nm and (b) quasi-CP mode (λ=1310 nm) and particle size of r=52 nm. The limit where the achiral force becomes stronger than the chiral force is at κ=0.17 for the quasi-TE mode and κ=0.19 for the quasi-CP mode. The forces were evaluated in the same position as in Figs. 2(c) and 2(d).
    Fig. 6. Net chiral and achiral forces exerted on a particle depending on its chirality parameter κ for (a) quasi-TE mode (λ=405  nm) along the x–direction and particle size r=80  nm and (b) quasi-CP mode (λ=1310  nm) and particle size of r=52  nm. The limit where the achiral force becomes stronger than the chiral force is at κ=0.17 for the quasi-TE mode and κ=0.19 for the quasi-CP mode. The forces were evaluated in the same position as in Figs. 2(c) and 2(d).
    Electric and magnetic field patterns of the guided modes discussed in the main text for a strip waveguide. The fields are split into the transversal (⊥) and longitudinal (z) components. The transversal components of the TE0 and TM0 modes lack an imaginary part, whereas the quasi-CP mode does due to the circular polarization of the mode induced by the phase delay of 90°.
    Fig. 7. Electric and magnetic field patterns of the guided modes discussed in the main text for a strip waveguide. The fields are split into the transversal () and longitudinal (z) components. The transversal components of the TE0 and TM0 modes lack an imaginary part, whereas the quasi-CP mode does due to the circular polarization of the mode induced by the phase delay of 90°.
    Josep Martínez-Romeu, Iago Diez, Sebastian Golat, Francisco J. Rodríguez-Fortuño, Alejandro Martínez. Chiral forces in longitudinally invariant dielectric photonic waveguides[J]. Photonics Research, 2024, 12(3): 431
    Download Citation