• Matter and Radiation at Extremes
  • Vol. 8, Issue 4, 045901 (2023)
Zhao Wang1、2, Rui Cheng1、2、3、a), Guodong Wang1、2, Xuejian Jin1、2, Yong Tang1, Yanhong Chen1, Zexian Zhou1、4, Lulin Shi1、4, Yuyu Wang1、2、3, Yu Lei1, Xiaoxia Wu1, and Jie Yang1、2、3
Author Affiliations
  • 1Institute of Modern Physics, Chinese Academy of Sciences, Lanzhou 730000, China
  • 2University of Chinese Academy of Sciences, Beijing 100049, China
  • 3Advanced Energy Science and Technology Guangdong Laboratory, Huizhou 516003, China
  • 4College of Physics and Electronic Engineering, Northwest Normal University, Lanzhou 730070, China
  • show less
    DOI: 10.1063/5.0144921 Cite this Article
    Zhao Wang, Rui Cheng, Guodong Wang, Xuejian Jin, Yong Tang, Yanhong Chen, Zexian Zhou, Lulin Shi, Yuyu Wang, Yu Lei, Xiaoxia Wu, Jie Yang. Observation of plasma dynamics in a theta pinch by a novel method[J]. Matter and Radiation at Extremes, 2023, 8(4): 045901 Copy Citation Text show less
    Schematic of experimental setup. The theta pinch comprises a glass vessel (length: 40 cm; internal diameter: 19.5 cm) surrounded by a six-turn copper solenoid coil, and a Rogowski coil, a photodiode, and a streaked spectrograph are used to obtain multiple parameters of the plasma therein.
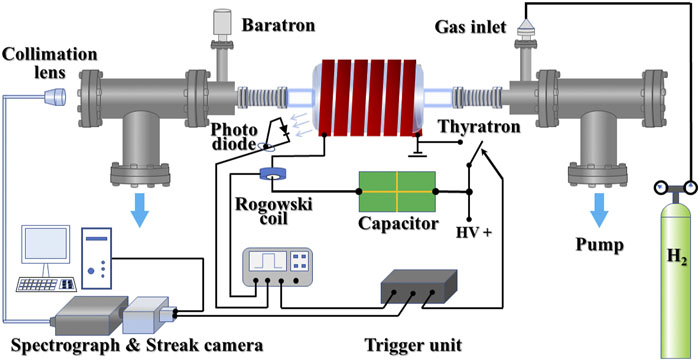
    Fig. 1. Schematic of experimental setup. The theta pinch comprises a glass vessel (length: 40 cm; internal diameter: 19.5 cm) surrounded by a six-turn copper solenoid coil, and a Rogowski coil, a photodiode, and a streaked spectrograph are used to obtain multiple parameters of the plasma therein.
    Typical temporal profiles of drive current (red) and luminosity (blue) measured at 20 Pa and 18 kV with a time resolution of 0.01 µs.
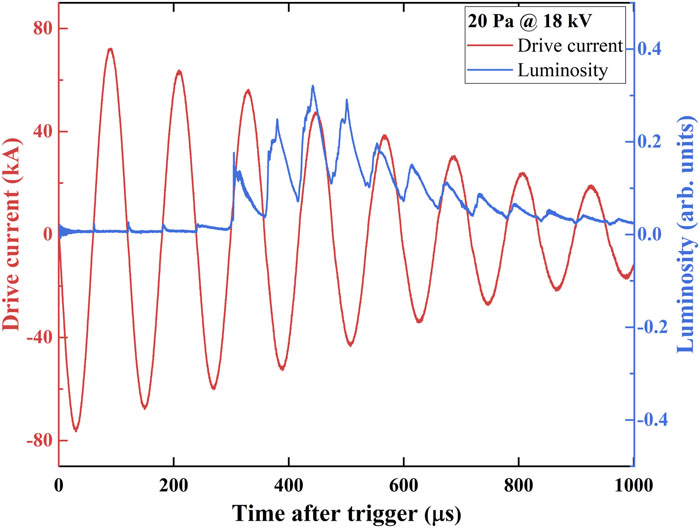
    Fig. 2. Typical temporal profiles of drive current (red) and luminosity (blue) measured at 20 Pa and 18 kV with a time resolution of 0.01 µs.
    Time-dependent image of Hβ spectra corresponding to discharge cycles 6–9 in discharge at 18 kV and 20 Pa.
    Fig. 3. Time-dependent image of Hβ spectra corresponding to discharge cycles 6–9 in discharge at 18 kV and 20 Pa.
    Time-dependent density and temperature of plasma in half-cycles 7 and 8 at 18 kV and 20 Pa as extracted from Fig. 3. The shaded regions show the corresponding error ranges.
    Fig. 4. Time-dependent density and temperature of plasma in half-cycles 7 and 8 at 18 kV and 20 Pa as extracted from Fig. 3. The shaded regions show the corresponding error ranges.
    Drive current (green), luminosity (black), electron density (blue), and electron temperature (red) in discharge half-cycle 7 at 18 kV and 20 Pa. The data are from Figs. 2 and 4 as measured simultaneously in one discharge experiment. Note that positive and negative current indicate only its direction in the primary loop.
    Fig. 5. Drive current (green), luminosity (black), electron density (blue), and electron temperature (red) in discharge half-cycle 7 at 18 kV and 20 Pa. The data are from Figs. 2 and 4 as measured simultaneously in one discharge experiment. Note that positive and negative current indicate only its direction in the primary loop.
    Schematic of configuration involving Lee model Reproduced from Lee et al., “A model code for the radiative theta pinch,” Phys. Plasmas 21, 072501 (2014) with the permission of AIP Publishing LLC.
    Fig. 6. Schematic of configuration involving Lee model Reproduced from Lee et al., “A model code for the radiative theta pinch,” Phys. Plasmas 21, 072501 (2014) with the permission of AIP Publishing LLC.
    (a) Experimental data for radial implosion phase with the three sub-phases marked at the top of the graph; the data are from Fig. 5, and the dotted lines are to guide the eye. (b) Radial trajectories of shock front (SF, red curve) and current sheath (CS, blue curve).
    Fig. 7. (a) Experimental data for radial implosion phase with the three sub-phases marked at the top of the graph; the data are from Fig. 5, and the dotted lines are to guide the eye. (b) Radial trajectories of shock front (SF, red curve) and current sheath (CS, blue curve).
    Experimental data for axial phase and anomalous heating phase, with the axial phase divided into two sub-phases as marked at the top of figure. The data are from Fig. 5, and the dotted lines are to guide the eye.
    Fig. 8. Experimental data for axial phase and anomalous heating phase, with the axial phase divided into two sub-phases as marked at the top of figure. The data are from Fig. 5, and the dotted lines are to guide the eye.
    (a) Schematic illustrating the reason for the second density peak. (b) CCD image showing formation of sausage instability during axial phase; the shoot began at time (f) with an exposure time of 20 µs.
    Fig. 9. (a) Schematic illustrating the reason for the second density peak. (b) CCD image showing formation of sausage instability during axial phase; the shoot began at time (f) with an exposure time of 20 µs.
    Zhao Wang, Rui Cheng, Guodong Wang, Xuejian Jin, Yong Tang, Yanhong Chen, Zexian Zhou, Lulin Shi, Yuyu Wang, Yu Lei, Xiaoxia Wu, Jie Yang. Observation of plasma dynamics in a theta pinch by a novel method[J]. Matter and Radiation at Extremes, 2023, 8(4): 045901
    Download Citation