
Zhao Wang, Rui Cheng, Guodong Wang, Xuejian Jin, Yong Tang, Yanhong Chen, Zexian Zhou, Lulin Shi, Yuyu Wang, Yu Lei, Xiaoxia Wu, Jie Yang. Observation of plasma dynamics in a theta pinch by a novel method[J]. Matter and Radiation at Extremes, 2023, 8(4): 045901
- Matter and Radiation at Extremes
- Vol. 8, Issue 4, 045901 (2023)
Abstract
I. INTRODUCTION
Plasma confinement using a strong magnetic field has been a key topic in the development of fusion energy over past decades,1–4 with problems in plasma magnetohydrodynamics (MHD) (i.e., the dynamics of plasma fluids in the presence of magnetic fields) being at the forefront of research into fusion yields.5–8 In particular, strong magnetic confinement has been applied to conventional inertial confinement fusion to improve significantly the robustness and performance of fusion implosion.9,10 This is known as magneto-inertial fusion (MIF),11 in which magnetizing the fusion fuel reduces electron thermal conduction losses in the core plasma, thereby relaxing substantially the minimum hot-spot conditions required for initiating thermonuclear burn.12–14 However, the magnetic field can also introduce other transport effects, some of which are detrimental. Therefore, a deeper investigation of plasma MHD is very important for understanding these processes,5,15 given how susceptible MIF implosion is to MHD instabilities;16 for instance, magnetized liner inertial fusion is affected significantly by sausage, kink, and magneto-Rayleigh–Taylor instabilities.13,17,18 Also, various issues require further study, such as the compression and transport of magnetic flux, implosion dynamics, and how strong magnetic fields influence the alpha-particle energy deposition from the hotspot.15,17,19
Several physical issues in MIF are also vitally important for theta-pinch plasmas, so investigating theta-pinch plasma dynamics can offer understanding of MIF physics from a relatively simple perspective. Generally, the evolution of a theta-pinch plasma involves two main phases: radial implosion and axial flow.20 In the radial phase, theta-pinch implosions driven by J × B forces are analogous to MIF implosions, where J is the current density and B is the magnetic field. Several studies have shown that the interaction between the imploding current sheath (CS) and the driven magnetic field can generate magnetic shock waves and collision-less turbulence,21 resulting in enhanced magnetic-field diffusion and anomalous electron heating.22–24 Also, the magnetic energy may be released by the generation of sausage instabilities to produce both neutrons and high-energy x-rays in a theta pinch with a field-reversed configuration.25,26 Moreover, the compression and transport of magnetic flux in a plasma can be studied via the CS compressing the reversed trapped field.27 In the axial phase, the plasma flow within axisymmetric magnetic field lines leads to several complex MHD problems, such as ionization waves, end losses, resistive diffusion, and MHD instabilities.28–32 The late-time behavior of MIF implosions is closely intertwined with these fundamental scientific problems, especially MHD instabilities,33,34 so studying theta-pinch plasma dynamics helps in modeling MIF accurately.
Several models have been proposed for investigating theta-pinch plasma dynamics. For the radial implosion phase, to describe theta-pinch implosions based on the snowplow model,35 various theories have been developed involving CS dynamics, pinch time, and energy transport, but there is yet to be good agreement between theory and experiment.36 Lee et al. proposed a new model that describes the implosion process as three phases, but its results are yet to be benchmarked experimentally.37,38 For the axial phase, theoretical treatments using the MHD approach to solve plasma flow problems are also somewhat limited,30,39,40 and some transport processes may not behave according to the formulation because of micro- and macro-instabilities.31 In experiments, high-speed framing cameras are used widely to photograph discharge sequences,28,41,42 but it is difficult to infer the details of plasma dynamics from photogrammetry alone because the key parameters of temperature and density are missing. Likewise, other means such as magnetic probes can characterize plasma dynamics in the radial implosion phase27,43 but fail regarding physical processes in the axial phase.
Herein, the dynamic evolution of a plasma in a cylindrical theta pinch is investigated using multiparameter measurements to obtain the temporal profiles of the drive current, luminosity, plasma density, and plasma temperature. Thus, a novel method is proposed for investigating theta-pinch plasma dynamics, and a more complete observation of plasma evolution is presented.
II. EXPERIMENTAL SETUP
A new cylindrical theta-pinch device was developed at the Institute of Modern Physics (IMP) of the Chinese Academy of Sciences; Cistakov et al. developed a similar device as an ion-stripper in the FAIR program.44 The IMP theta pinch comprises a 64-µF capacitor bank, a thyratron switch, and a glass vessel (19.5 cm in diameter, 40 cm in length) surrounded by a six-turn copper solenoid coil. These components form a closed RLC circuit with a resonance frequency of 8.0 kHz and an inductance of 5.73 µH; the load voltage can vary from 15 to 30 kV, and the maximum stored energy is ∼28.8 kJ. A needle leak valve is used for precise control of the pressure of hydrogen gas (99.99% purity), and a vacuum gauge (Pfeiffer PKR 361) monitors the pressure inside the vessel. At both sides of the pinch, there is a differential pumping system comprising two turbo pumps and one mechanical pump. In an experiment, a hydrogen plasma was generated at a pressure of 20 Pa and a discharge voltage of 18 kV, and an azimuthal CS formed near the wall of the vessel when the bank was fired. As a result of the J × B force, the CS moved radially, and all matter in the vessel that it encountered was ionized and compressed inwardly, yielding a dense and hot plasma near the axis.
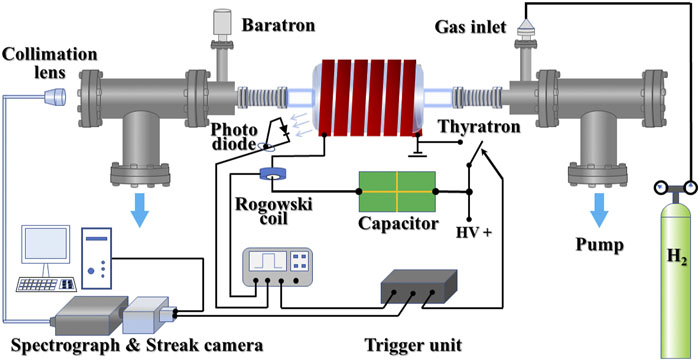
The experimental setup is shown schematically in Fig. 1. A 1-GHz bandwidth oscilloscope (Tektronix MDO3104), a Rogowski coil (Stangenes Item#3), and a fast photodiode (DET10A, 200–1100 nm) were used for synchronous acquisition of the oscillograms of the drive current and luminosity. The plasma parameters of free electron density and temperature were measured spectroscopically using a streaked optical spectrometry diagnostic system comprising a spectrometer and a streak camera. The measurements were performed along an axial line of sight, with an optical collector positioned on the symmetry axis of the vessel at 0.5 m from the center. The light emitted from the plasma was transmitted by an optical fiber to the spectrometer, and a 1200/mm grating with a dispersion of 4.231 nm/mm was chosen, corresponding to a wavelength resolution of 0.14 nm. The scanning time of the streak camera was 210 µs with a temporal resolution of ∼0.08 µs. Before the experiments, a mercury lamp was used to calibrate the spectral resolution of the diagnostic system, yielding a FWHM of 0.4 ± 0.05 nm. All the experimental operations were synchronized by a high-precision control unit with a digital delay generator (Stanford DG645).
![]()
Figure 1.Schematic of experimental setup. The theta pinch comprises a glass vessel (length: 40 cm; internal diameter: 19.5 cm) surrounded by a six-turn copper solenoid coil, and a Rogowski coil, a photodiode, and a streaked spectrograph are used to obtain multiple parameters of the plasma therein.
III. RESULTS AND DISCUSSION
A. Observation of ignition behavior
Temporal profiles of the drive current and luminosity during discharge were measured, and typical results for the theta-pinch hydrogen plasma are shown in Fig. 2 for a pressure of 20 Pa and a discharge voltage of 18 kV. As determined experimentally, our experiments exhibited good reproducibility for shot-to-shot discharge. Figure 2 shows that the drive-current oscillogram is a typical RLC signal with a peak current approaching 80 kA at 29.56 µs and a current rise rate of ∼2.7 kA/μs. The luminosity shows that no plasma is produced in the first few discharge half-cycles (half-waves), during which time a pre-ionization process is believed to occur and an amount of free charge accumulates.45 After the sixth half-cycle, the luminosity increases dramatically, showing that the plasma has ignited. In half-cycles 7–14 of the discharge, sequential pinch plasma is produced, and the plasma duration in each half-cycle is ∼60 µs.
![]()
Figure 2.Typical temporal profiles of drive current (red) and luminosity (blue) measured at 20 Pa and 18 kV with a time resolution of 0.01
B. Measurements of electron density (Ne) and electron temperature (Te)
In parallel with measuring the drive current and luminosity, the hydrogen plasma was investigated synchronously using optical emission spectrometry.46 As mentioned above, a streaked optical spectrometry diagnostic system was used to measure the plasma spectra, and to ensure an appropriate time resolution and cover the half-cycles of intense discharge in which we are interested, the scanning time of the streak camera was 210 µs with a resolution of 0.08 µs. Figure 3 shows a raw image of the measured Hβ spectra varying with time corresponding to discharge half-cycles 6–9, and the temporal profiles of electron density and temperature can be extracted from the Hβ spectra.
![]()
Figure 3.Time-dependent image of Hβ spectra corresponding to discharge cycles 6–9 in discharge at 18 kV and 20 Pa.
The electron density Ne is determined by measuring the broadening of the Hβ line in the Balmer series for atomic hydrogen; the favored Hβ line has offered the most accurate diagnosis of electron density in numerous theoretical and experimental studies because it is quite sensitive to the Stark effect and its temperature dependence is quite low.47–49 Determining Ne from the FWHM (Δλ1/2) of the Hβ line is done frequently using the following well-established empirical expression:50,51
The electron temperature Te was determined using plasma line-to-continuum thermometry, which also uses the hydrogen Hβ line. As noted by Kunze,47 for a hydrogen plasma, the ratio of suitable line intensities to the underlying continuum provides a convenient and accurate temperature diagnostic. Furthermore, the theoretical uncertainty of the line-to-continuum technique is negligible, and the accuracy in temperature measurement is better than 10%.53,54
Figure 4 shows the evolutions of free electron density and temperature in half-cycles 7 and 8, during which the discharge is the strongest throughout the plasma duration (half-cycles 6–14). The maximum density is 3.6 × 1016 cm−3 and the maximum temperature is 4.18 eV, while the minimum temperature during the two half-cycles remains larger than 1.4 eV, resulting in a hydrogen ionization degree exceeding 90% as estimated using a corona model,37 so the plasma is almost fully ionized.
![]()
Figure 4.Time-dependent density and temperature of plasma in half-cycles 7 and 8 at 18 kV and 20 Pa as extracted from
More interestingly, in each half-cycle, the temporal profiles of density and temperature exhibit certain features; for instance, two peaks occur in the density profile, and the temperature peak is reached earlier than the density peak by several microseconds. Herein, we propose a novel method for characterizing the plasma dynamics by analyzing these features.
C. Theta-pinch plasma dynamics
It is known that plasma density and temperature are closely associated with plasma dynamics. In Fig. 4, the temporal resolution (<0.1 µs) of the plasma measurements is much less than the characteristic time of the plasma dynamics; in particular, for our plasma temperature, the time scale for the diffusion of magnetic flux in the plasma column is longer than 1.0 µs. Therefore, we attempt to trace the plasma dynamics based on the experimental results for free electron density and temperature and the following two additional aspects: (i) the drive current is proportional to the driven magnetic field Bz,55 which is responsible for generating and maintaining the plasma; (ii) the luminosity reflects the relative intensity of discharge and plasma radiation, and crucially it provides a benchmark for the timing sequence of discharge events.42
Figure 5 shows a typical combination of the four parameters of temperature (red), density (blue), drive current (green), and luminosity (black) in a specific plasma period (half-cycle 7). The data are from Figs. 2 and 4 as measured simultaneously in one discharge experiment. Because of the good reproducibility for shot-to-shot discharge in our experiments, these features are almost the same in each discharge half-cycle, and so the discussion based on Fig. 5 is representative.
![]()
Figure 5.Drive current (green), luminosity (black), electron density (blue), and electron temperature (red) in discharge half-cycle 7 at 18 kV and 20 Pa. The data are from
For clarity of discussion, Fig. 5 contains some time labels. The plasma duration is ∼58.3 µs, which is consistent with the time interval between the two zero-crossings of the drive current, so the start and end times are those marked as (a) and (i), respectively. Combining the relevant theta-pinch models and knowledge of plasma dynamics, we divide the whole plasma evolution into three phases, i.e., radial implosion, axial flow, and anomalous heating, which are introduced in detail below.
1. Radial implosion phase
For a theta-pinch plasma, we know that the discharge begins in the nonadiabatic region near the reversal of the drive current.42,45,56 Starting from time (a), the azimuthal CS forms near the vessel wall where the induced electric field is largest,45,56 and the subsequent CS implosion can be described by the snowplow model35 as developed further in detail by Lee et al.37 Shown schematically in Fig. 6, the Lee model describes the implosion process with the following three modeled phases.
![]()
Figure 6.Schematic of configuration involving Lee model Reproduced from Lee
In terms of our experimental data (in Fig. 5), the radial implosion phase can also be described by the IS, RS, and pinch phases. Figure 7(a) shows the three phases marked on the top of the graph, with the data extracted from Fig. 5, and Fig. 7(b) shows the radial trajectories of the SF and CS as established by model analysis.
![]()
Figure 7.(a) Experimental data for radial implosion phase with the three sub-phases marked at the top of the graph; the data are from
The discharge starts at time (a) when the CS forms, but the luminosity remains constant for ∼1.7 µs from time (a) to (b). This can be attributed to the fact that the drive current is insufficiently large and the trapped reverse magnetic flux from the previous half-cycle persists. Therefore, the inward drive magnetic pressure fails to exceed the outward magnetic pressure exerted by the trapped reverse flux, and so the shock compression and heating cannot begin immediately.43
After time (b), the luminosity increases dramatically and the IS phase begins; it ends at time (c) when the luminosity peaks and the SF reaches the axis. Further evidence is provided by the fact that the electron density increases from time (b) to (c) with a slope of kIS = 0.11 but then increases faster from time (c) with a slope of kRS = 0.52. This is expected from the onset of the RS phase and the plasma being double-heated and compressed. From Fig. 7(a), the duration of the IS phase is 5.0 µs, and the average velocity of the SF is calculated as 1.95 cm/μs (the vessel radius is 9.75 cm). For a hydrogen theta-pinch plasma, Ebrahim et al. discussed the plasma dynamics in the IS phase,57 with the CS and SF accelerating approximately uniformly. Therefore, the velocity of the SF when it reaches the axis is estimated as 3.90 cm/μs if we assume that the SF accelerates uniformly from an initial velocity of zero in the IS phase. According to shock wave theory, the plasma temperature dominated by shock heating is given by
From thermodynamics, the relationship between the shock wave velocity vs and the CS velocity vp is57
These trajectories are shown in Fig. 7(b) [from time (b) to (c)]; the radii of the SF and CS decrease with time, and clearly the SF velocity is larger than the CS velocity. All the matter ahead of the CS swept up by the quickly moving SF is compressed and heated, which results in a plasma slug forming between the SF and CS, and as the SF moves inwardly, the plasma slug thickens gradually. At time (c) when the SF reaches the axis, the radius of the CS is ∼2.25 cm, which is the largest thickness of the so-called plasma slug.
Starting from time (c), the RS phase plays a role. The plasma between the CS and RS is doubly shock-compressed and heated, and consequently the electron density in this phase increases faster than in the IS phase, where kRS = 0.52 > kIS = 0.11. For shock heating, the temperature is determined by the shock speed, and we find that the temperature continues to increase after time (c), which shows that the relative velocity of the RS moving to the CS is even larger than the velocity of the IS hitting the axis. This temperature rise lasts for ∼0.9 µs [after time (c)], after which the temperature falls gradually because of the relative motion deceleration and thermal conduction.37 When the RS meets the CS, the RS phase ends, and the end time is identified as time (d), after which the density slope decreases to kpinch = 0.24 because the double heating and compression have ended. The RS trajectory is shown in Fig. 7(b) from time (c) to (d) as obtained from the model due to Lim et al.,58 which suggests that the velocity of the outwardly moving RS at each point is one-third of that of the inwardly moving SF at that point. The results show that the plasma column has a radius of 1.80 cm when the RS phase ends at time (d). Moreover, a hypothetical CS trajectory in the RS phase is shown in Fig. 7(b) from time (c) to (d); this is based on the experimental results presented by McKenna et al. showing an oscillating radius in the plasma column,24,32 and the oscillating luminosity in our data seems to prove our hypothesis.
At time (d), the slow compression (pinch) phase starts, and the plasma obtains energy from Joule heating and loses energy via plasma radiation and thermal conduction.37 The drive current continues to increase, as does the magnetic pressure acting on the CS. The plasma density increases until time (e) in our data, which shows that the magnetic pressure exceeds the kinetic pressure, and so the plasma column is compressed further. In contrast, the temperature drops rapidly, and from time (e) to (f), the plasma temperature and density apparently plateau as expected as a special state in the pinch phase. In this special state, an equilibrium is achieved between kinetic pressure and magnetic pressure, and the energy gained from Joule heating balances that lost via radiative cooling and thermal conduction.
2. Axial flow phase
End loss of the plasma in a theta pinch is a well-established phenomenon30,39 and always occurs at the end of the radial implosion phase.32 In the absence of an axial confinement force, axial plasma flow from the center to the ends of the coil is responsible for this phenomenon,31 and the typical result of end loss is decreased density and temperature of the plasma column.30 In our work, end loss is evident in the phase from time (f) to (g), and the details are shown in Fig. 8. In this phase, the drive current continues to increase, as does the radial magnetic pressure, so the decreased density and temperature can be attributed only to the axial plasma flow.
![]()
Figure 8.Experimental data for axial phase and anomalous heating phase, with the axial phase divided into two sub-phases as marked at the top of figure. The data are from
It is interesting that the electron density peaks again between time (g) and (f) in Fig. 8. Based on features of the end loss, we attribute this phenomenon to the formation of m = 0 (sausage) instability in a plasma column in a magnetic field. This mechanism is shown schematically in Fig. 9(a) and is discussed below.
![]()
Figure 9.(a) Schematic illustrating the reason for the second density peak. (b) CCD image showing formation of sausage instability during axial phase; the shoot began at time (f) with an exposure time of 20
End loss is generally accompanied by two important phenomena: (i) a throat (constricted cross section) forms at each end of the plasma column,20,30 and (ii) the end-loss plasma is ejected through the throats into the end regions at a speed greater than the sound speed.31 The ejected plasma interacts with the ambient gas and ionizes it via shock heating,32 and the ejected plasma is dominated by electron streams because electrons are lighter than ions and travel faster when in thermodynamic equilibrium. As shown in Fig. 9(a), a relative drift happens between electrons and hydrogen ions, and consequently the produced axial current density jz flows from the ends to the mid-plane of the plasma. Physically, current flows through a plasma column surrounded by an azimuthal magnetic field Bθ = μI/2πr, where r is the boundary radius of the plasma column and I is the total current enclosed within the radius.59 Therefore, Bθ is stronger near the throats than elsewhere in the plasma column, and this configuration is unstable because the stronger Bθ leads to further compression of the throats and triggers the so-called sausage instability. Growth of this instability results in the rapid changes in radius and Bθ at the throats, which induce the strong axial electric fields E.60 The latter push the outwardly moving electrons inwardly, and even some of the electrons from the ionized ambient gas are forced inwardly. Overall, the sausage instability associated with the plasma axial flow suppresses the plasma end-loss. The results of these processes are manifested experimentally as an increased electron density and formation of a sausage-shaped plasma column.
Further evidence for the aforementioned mechanism is provided by an image obtained by a CCD camera facing one side of the vessel. The observation was synchronized by using the current signal, and the synchronization uncertainty was less than 0.5 µs; the shoot began at time (f) with an exposure time of 20 µs. Figure 9(b) shows the evidences that the ambient gas is ionized by ejected plasma and the structure of sausage instability (constricted region I) forms. The experimental observation is almost consistent with the proposed model shown schematically in Fig. 9(a). Note that constricted region II also resulted from the development of sausage instability, which may have been triggered by the larger drive magnetic field at the center than at either side. This does not affect our discussion about the second density peak, but Fig. 9(a) incorporates the constricted region II nevertheless.
3. Anomalous heating phase
Previous reports have shown that the anomalous transport processes associated with the micro-instabilities in theta pinches play an important role in plasma heating.21,61 Such an anomalous heating phenomenon is observed in the post-implosion stage in our results: an abrupt increase in the temperature occurs starting from time (h) in Fig. 8, and this abrupt change of temperature cannot be explained by the classical Joule heating because it is less effective at the present plasma temperature.62
In general, the micro-instabilities in theta pinches include Buneman, ion acoustic, lower-hybrid-drift (LHD), and modified-two-stream instabilities, which are driven by cross-field currents,21 and our experimental data show that cross-field currents are generated in the CS. In Fig. 8, the drive current decreases from time (h), and the properties of the induced current in the CS change correspondingly. As the drive current decreases, so does the magnetic flux through the plasma column. This induces a paramagnetic current in the CS, and the induced current is in the same direction as the drive current. Thus, the magnetic pressure on the CS is radially outward, and the plasma column expands radially. These processes are confirmed by the sharp drop in electron density in our data [around time (h) in Fig. 8]. As the plasma expands outwardly, the motion of the CS across magnetic field B with velocity Ve induces an electric field E ≈ −Ve × B, which is known to produce cross-field currents.63 As a result, the micro-instabilities driven by cross-field currents develop near the CS.
Furthermore, for the post-implosion stage of theta pinches, numerous studies of micro-instabilities have shown that the LHD instability is the most likely high-frequency candidate for producing significant anomalous transport.64 The LHD instability can generate turbulent field fluctuations that scatter particles and lower the plasma conductivity.21 Such anomalous resistivity due to wave–particle interactions leads to strongly enhanced magnetic diffusion and plasma heating.65 We know that the LHD instability is characterized by strongly magnetized electrons and unmagnetized ions,21,63 conditions that are naturally met under our plasma conditions. Therefore, we deduce that the abrupt temperature rise observed in Fig. 8 results from anomalous resistivity due to the LHD instability.
IV. CONCLUSIONS
Herein, we have presented a novel experimental method for investigating plasma dynamics in theta pinches, as well as a more complete observation of plasma evolution. The experiments were carried out on the newly developed IMP theta pinch where hydrogen plasmas are generated. Highly time-resolved profiles of drive current, luminosity, plasma density, and temperature were measured simultaneously, and using this novel method, we observed the plasma evolving in three phases, i.e., radial implosion, axial flow, and anomalous heating. In the radial implosion phase, the experimental data showed that the Lee model37 is appropriate for describing the theta-pinch implosion, and the radial trajectories of the CS and shock wave were determined in a self-consistent way. In the axial flow phase, the experimental data showed that the electron density peaks again after the plasma end-loss. This phenomenon is explained well by our proposed model associated with m = 0 (sausage) instability, in which strong axial electric fields are induced at the ends of the plasma column and the density is increased by compressing the plasma axially. In the anomalous heating phase, an abrupt increase in temperature is observed, and analyzing the experimental data showed that the motion of the CS across the drive magnetic field produces cross-field currents that can induce the LHD instability, causing anomalous resistivity and anomalous plasma heating.
The experimental data and investigation methods presented herein offer improved understanding of plasma dynamics in the presence of magnetic fields and provide important support for relevant research in MIF.
ACKNOWLEDGMENTS
Acknowledgment. This work was supported by the State Key Development Program for Basic Research of China (Grant No. 2022YFA1602503) and the National Natural Science Foundation of China (Grant Nos. 12120101005 and 11775278). The authors thank Mr. Zhu Bingli for technical support for streak camera T10 and Professor Sing Lee (Institute for Plasma Focus Studies, Australia) for useful discussions.
References
[1] A. H.Boozer. Physics of magnetically confined plasmas. Rev. Mod. Phys., 76, 1071(2004).
[8] S.Molokov, S.Molokov, and R.Moreau, R.Moreau, S.Molokov, and R.Moreau, K.Moffatt. Magnetohydrodynamics(2007).
[20] W. B.Thompson. Physics of Hot Plasmas(1968).
[29] A. A.Newton. Area waves in a theta pinch. Nucl. Fusion, 8, 93-97(1968).
[35] M.Rosenbluth. Infinite conductivity theory of the pinch. Los Alamos Scientific Laboratory Report LA-1850(1954).
[46] H. R.Griem. Principles of Plasma Spectroscopy(1997).
[47] H.-J.Kunze. Introduction to Plasma Spectroscopy(2009).
[53] H. R.Griem. Plasma Spectroscopy(1964).
[54] C. G.Parigger, G.Parigger C., M.Helstern C., A.Drake K., G.Gautam and, C. M.Helstern, G.Parigger C., M.Helstern C., A.Drake K., G.Gautam and, K. A.Drake, G.Parigger C., M.Helstern C., A.Drake K., G.Gautam and, G.Gautam. Balmer-series hydrogen-beta line dip-shifts for electron density measurements. Int. Rev. At. Mol. Phys, 8, 73-79(2017).
[59] T. J. M.Boyd, J. T., J. J.Sanderson. The Physics of Plasmas(2004).

Set citation alerts for the article
Please enter your email address
© Copyright 2018-2021 | Chinese Laser Press. All Rights Reserved 沪ICP备15018463号-20