• Laser & Optoelectronics Progress
  • Vol. 55, Issue 5, 053003 (2018)
Haibin Cui*, Fei Wang, and Meiyi Li
Author Affiliations
  • College of Energy Engineering, State Key Laboratory of Clean Energy Utilization, Zhejiang University, Hangzhou, Zhejiang 310027, China
  • show less
    DOI: 10.3788/LOP55.053003 Cite this Article Set citation alerts
    Haibin Cui, Fei Wang, Meiyi Li. Measurements of CO2 Temperature and Concentration in High Temperature Environment Based on Tunable Diode Laser Absorption Spectroscopy[J]. Laser & Optoelectronics Progress, 2018, 55(5): 053003 Copy Citation Text show less
    Absorption line strength of (a) CO, (b) H2O and (c) CO2 in the wavelength range of 1-3 μm
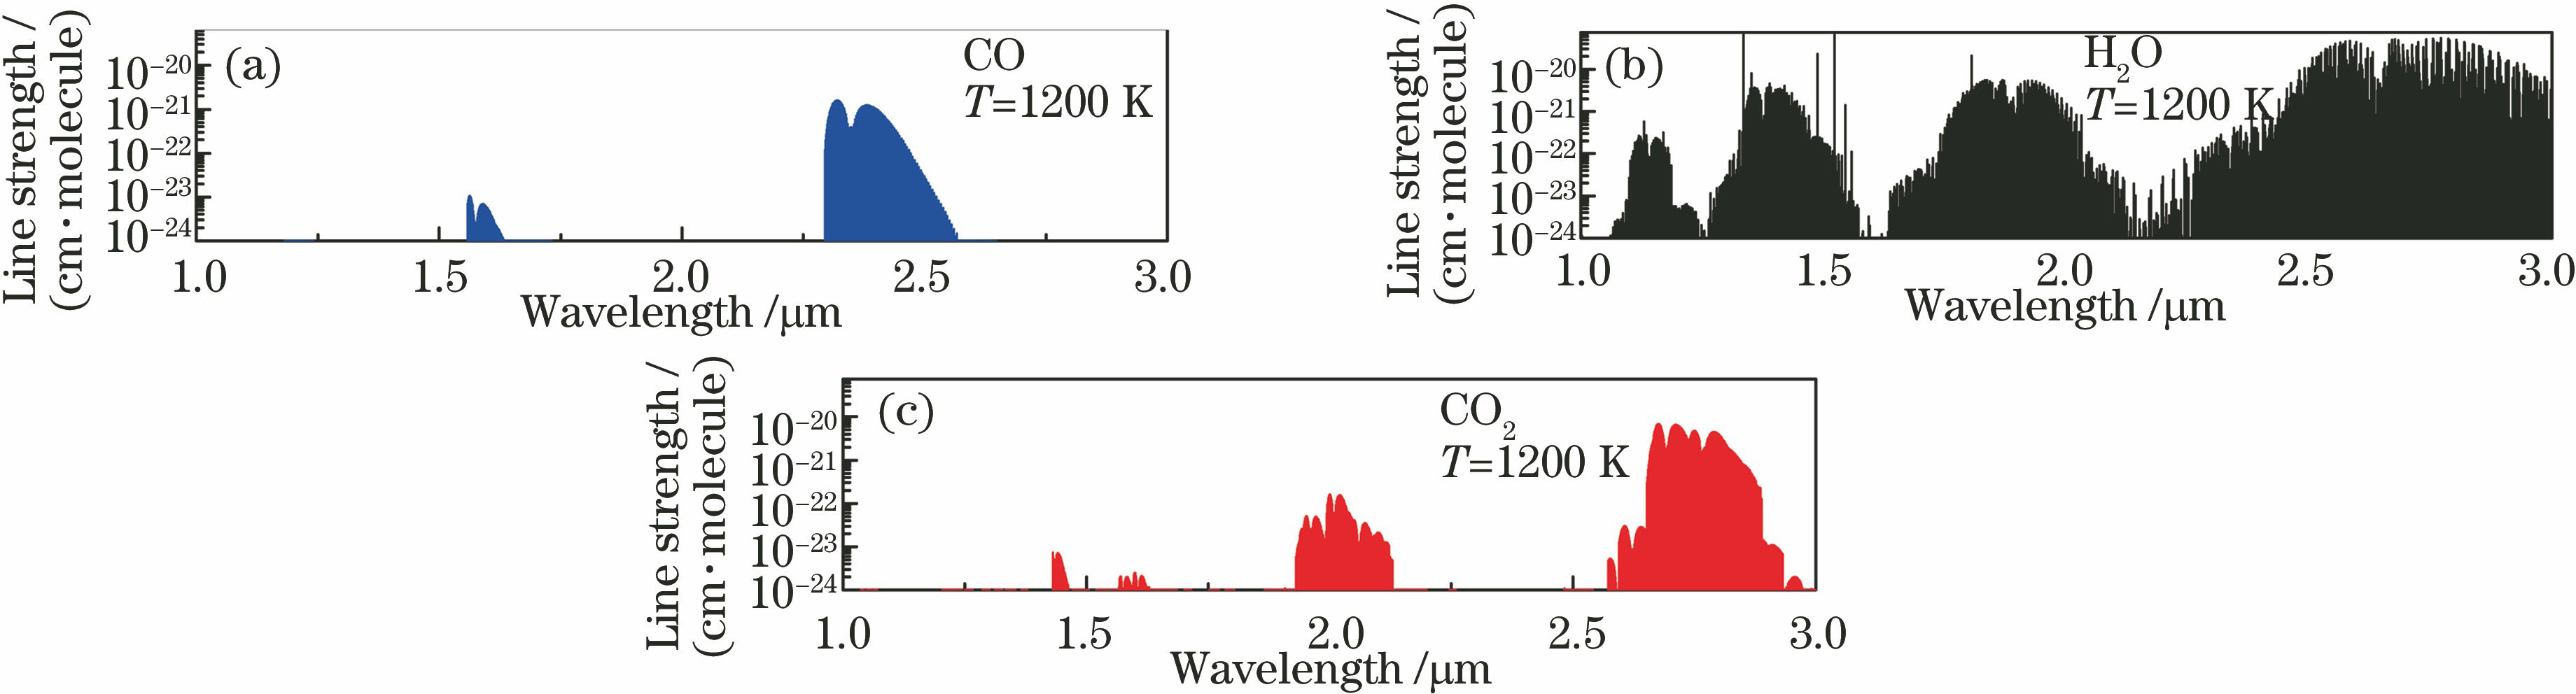
    Fig. 1. Absorption line strength of (a) CO, (b) H2O and (c) CO2 in the wavelength range of 1-3 μm
    Simulated absorption spectra
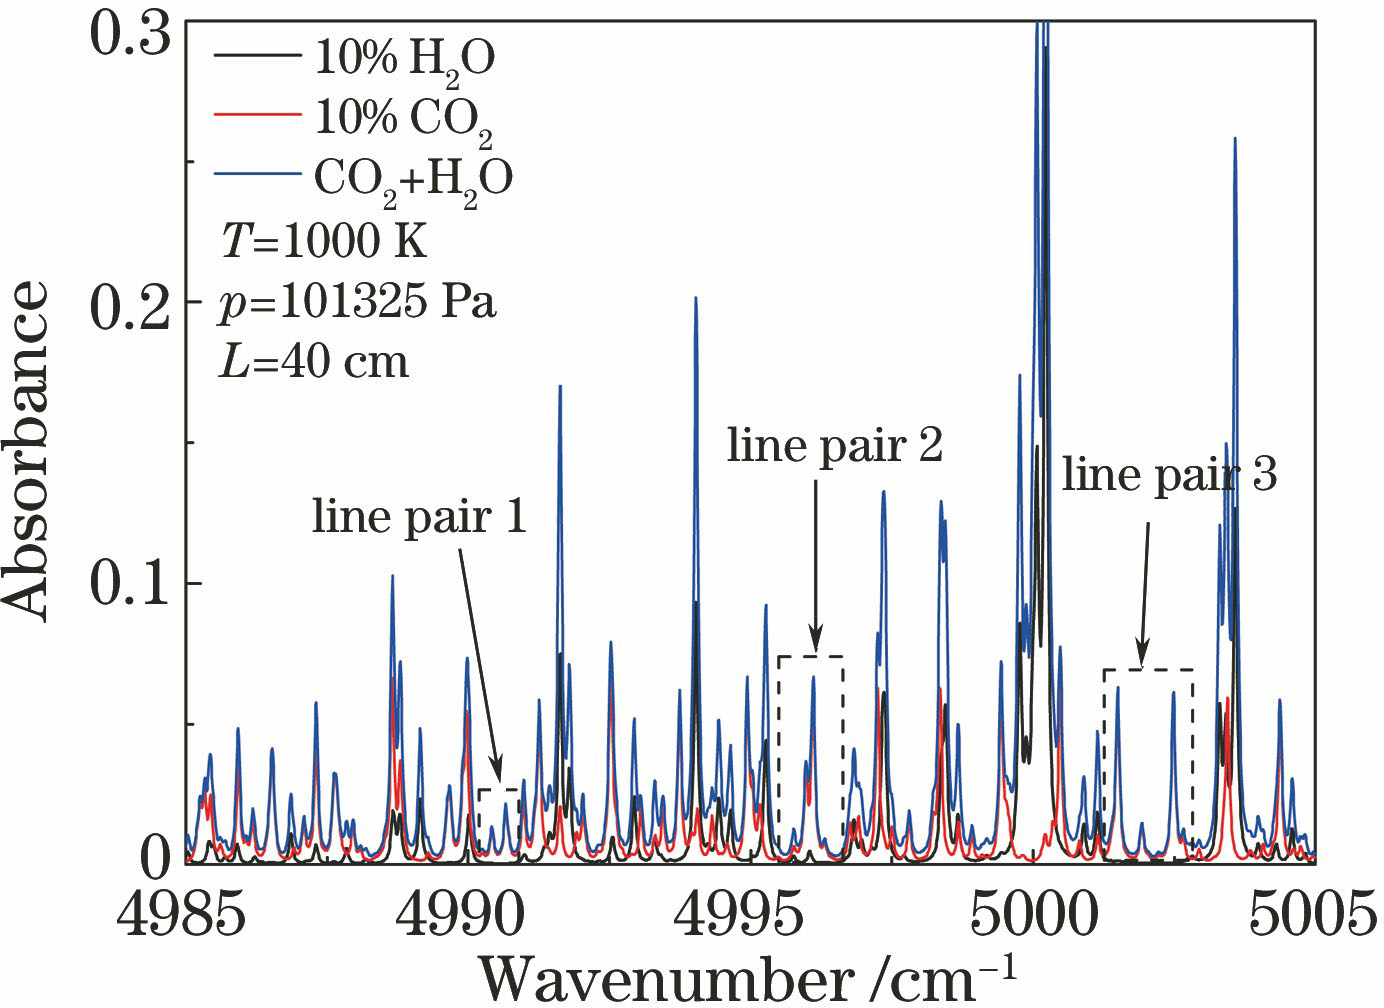
    Fig. 2. Simulated absorption spectra
    Simulated results of line pairs. (a) Line pair 1; (b) line pair 2; (c) line pair 3
    Fig. 3. Simulated results of line pairs. (a) Line pair 1; (b) line pair 2; (c) line pair 3
    (a) Variations of line strength with temperature; (b) line strength ratio and their sensitivity with temperature
    Fig. 4. (a) Variations of line strength with temperature; (b) line strength ratio and their sensitivity with temperature
    Diagram of the high temperature measurement system
    Fig. 5. Diagram of the high temperature measurement system
    (a) Spectral absorption signal and multi-peak fitting results using Voigt function and (b) fitting residual
    Fig. 6. (a) Spectral absorption signal and multi-peak fitting results using Voigt function and (b) fitting residual
    LinepairCenterwavenumberν0 /cm-1Centerwavelengthλ /nmLine-intensityS0 (T= 900 K) /(10-7 cm-2·Pa-1)Low transitionenergy E″/cm-1
    14990.4182003.84022.812462.6758
    4990.6652003.74106.551276.4475
    24995.97022001.61324.331702.4031
    4995.97982001.60940.1514059.1287
    4995.98442001.60754.91586.8582
    4996.10852001.557824.2273.868
    35001.49871999.400722.7519.535
    5001.91591999.23392.382193.5452
    5001.94681999.22161.482551.011
    5002.48691999.005721.8578.0115
    Table 1. CO2 spectral absorption-line parameters
    Volume fraction ofCO2/%Measured temperature /K
    873 K973 K1073 K1173 K1273 K
    10881.6994.41087.81160.01260.1
    8868.9946.81055.61160.91284.6
    6890.7996.71100.31205.71241.6
    4898.3950.11042.11135.31228.6
    Table 2. Measured temperature under different operating conditions
    Volume fraction ofCO2 /%Deviation /%
    873 K973 K1073 K1173 K1273 K
    100.982.201.38-1.11-1.01
    8-0.47-2.70-1.62-1.030.91
    62.032.442.552.79-2.47
    42.90-2.35-2.88-3.21-3.49
    Table 3. Deviation of measured temperatures with given temperature
    Volume fraction ofCO2/%Measured volume fraction of CO2
    873 K973 K1073 K1173 K1273 K
    109.909.809.8610.1410.20
    88.128.158.098.178.14
    66.126.186.086.115.89
    44.123.873.893.853.87
    Table 4. Measured CO2 concentration under different operating conditions
    Volume fraction ofCO2 /%Deviation /%
    873 K973 K1073 K1173 K1273 K
    10-1.00-2.00-1.401.402.00
    81.501.881.132.131.75
    62.003.001.331.83-1.83
    43.75-3.25-4.75-3.75-3.25
    Table 5. Deviation of measured CO2 concentration with given value under different operating conditions
    Haibin Cui, Fei Wang, Meiyi Li. Measurements of CO2 Temperature and Concentration in High Temperature Environment Based on Tunable Diode Laser Absorption Spectroscopy[J]. Laser & Optoelectronics Progress, 2018, 55(5): 053003
    Download Citation