
Linling Tan, Yanqing Fu, Shiliang Kang, Lothar Wondraczek, Changgui Lin, Yuanzheng Yue, "Broadband NIR-emitting Te cluster-doped glass for smart light source towards night-vision and NIR spectroscopy applications," Photonics Res. 10, 1187 (2022)
- Photonics Research
- Vol. 10, Issue 5, 1187 (2022)
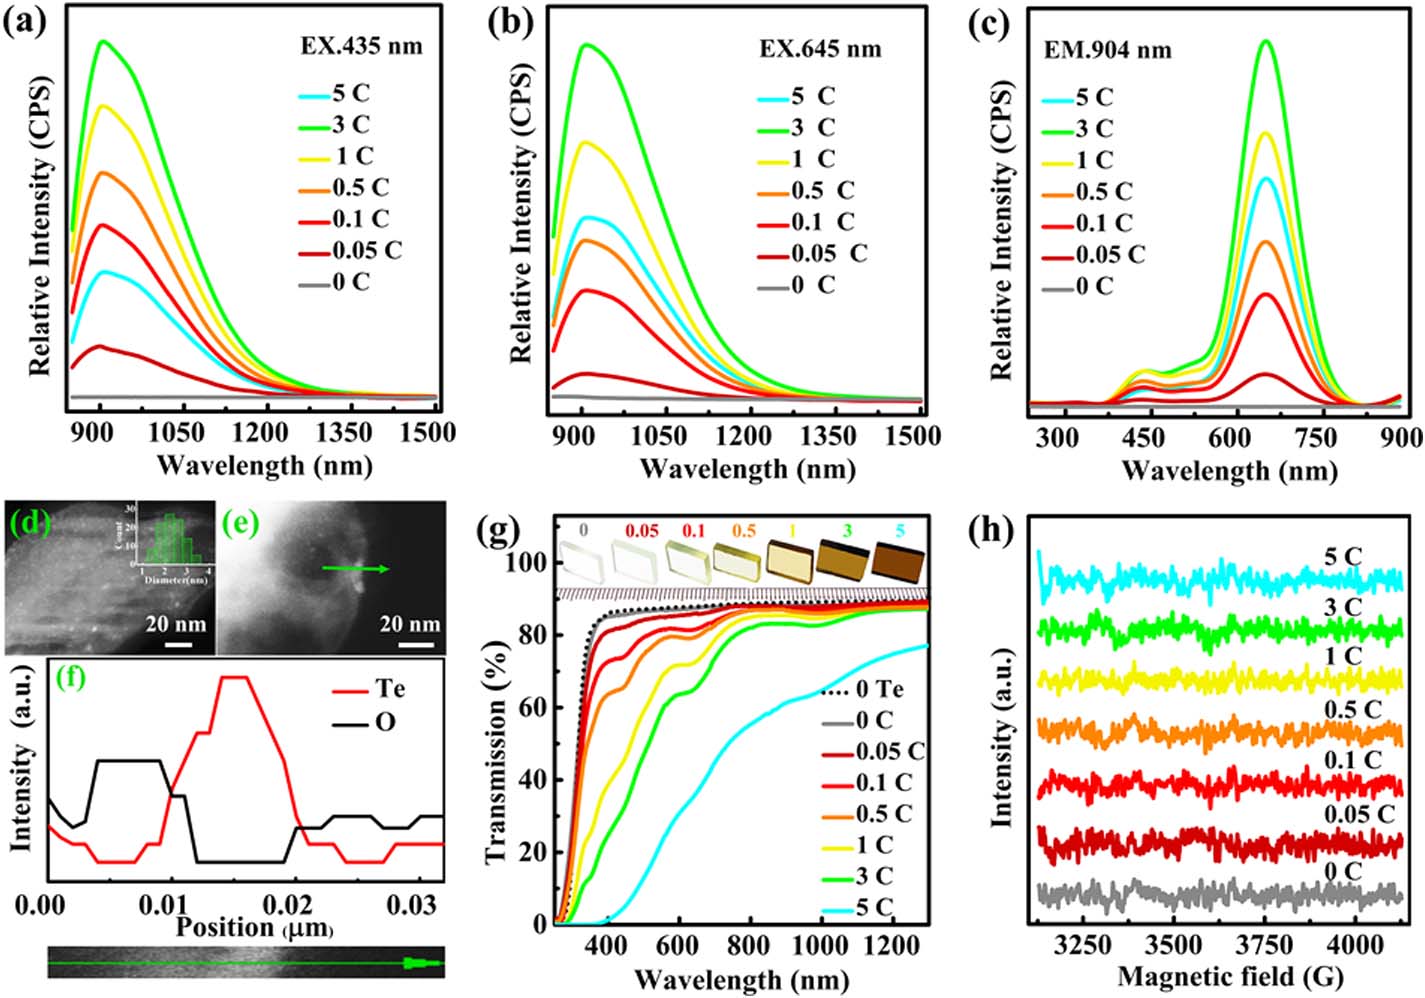
Fig. 1. Occurrence and identification of Te clusters. Emission spectra upon (a) 435 nm and (b) 645 nm excitation. (c) The excitation spectra monitored at 904 nm of glass samples B – x C x = 0 O B – x C x = 0 B – x C x = 0
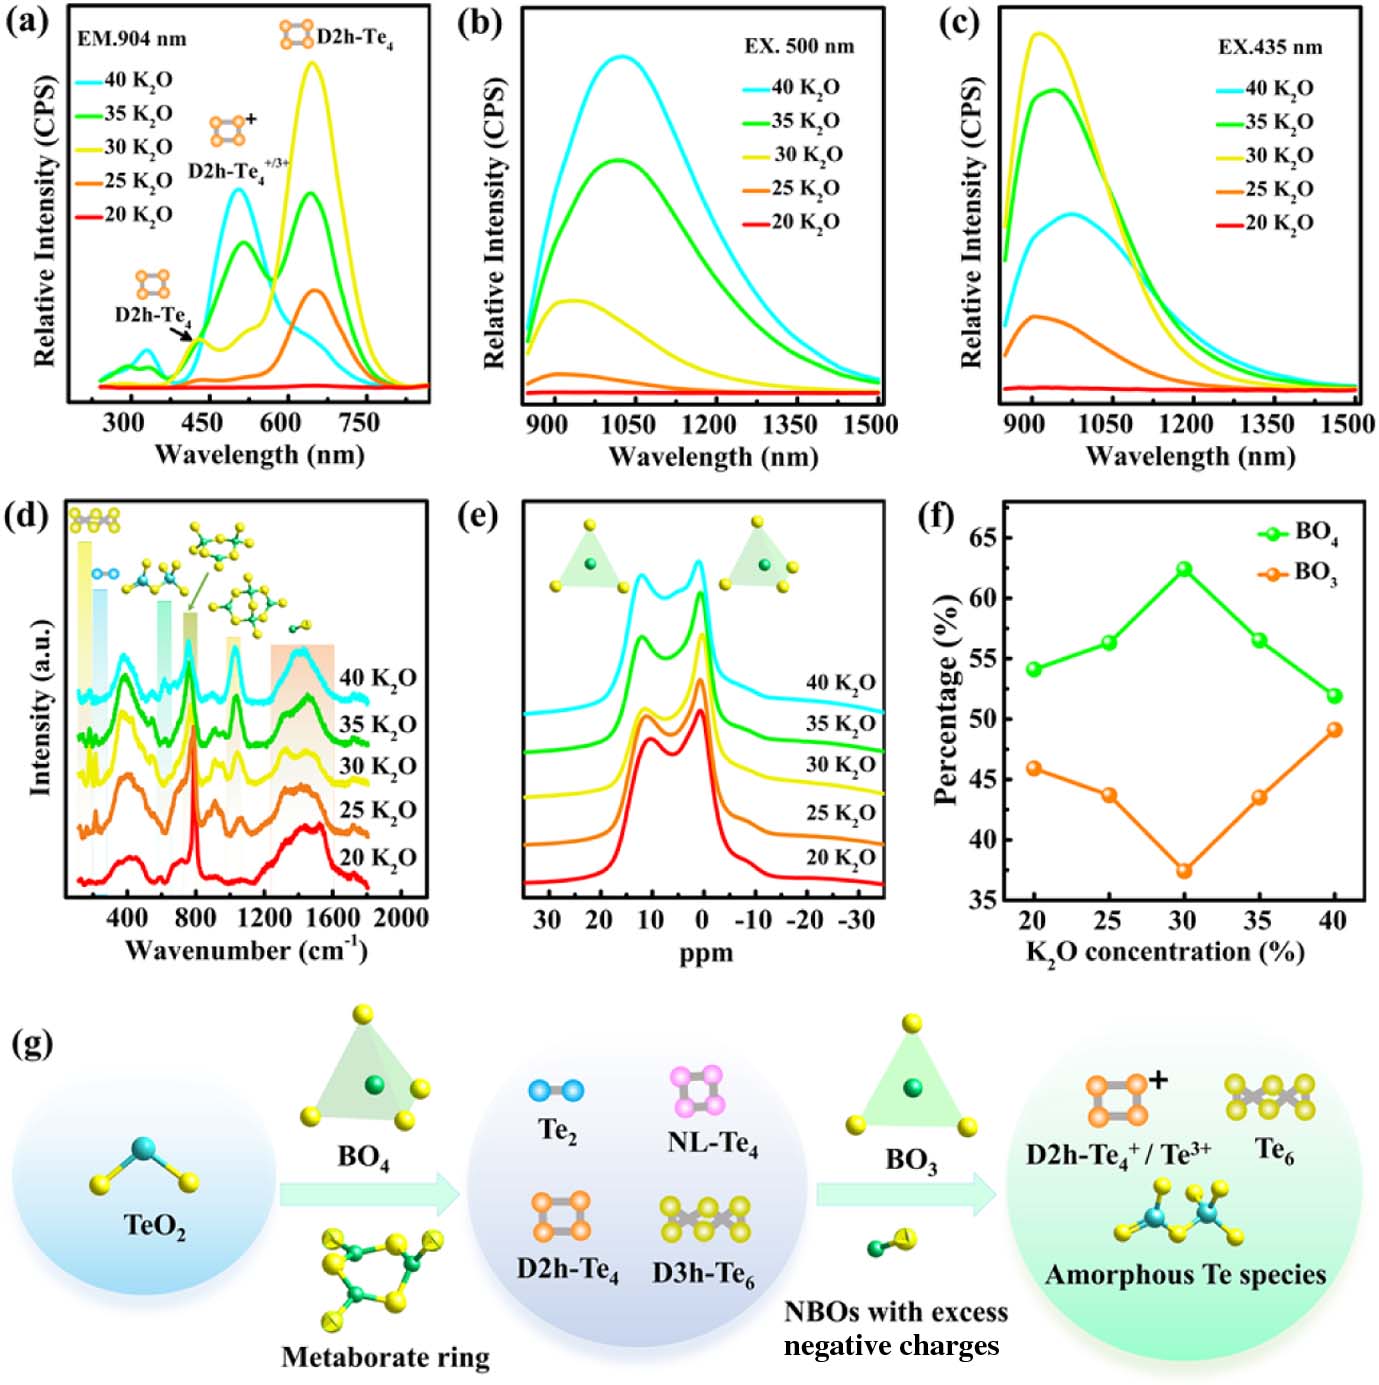
Fig. 2. Tunable luminescence behavior of Te clusters and manipulation of Te speciation through network modifiers. (a) The excitation spectra monitored at 904 nm. The emission spectra upon (b) 500 and (c) 435 nm excitation. (d) The Raman spectra and (e) the B 11 B – y K y = 20 BO 3 BO 4 K 2 O
Fig. 3. Electroluminescence performance of Te cluster-doped glass converted-LED device. (a) The electroluminescence spectra of the as-fabricated NIR LED based on B-40K under different driven currents. Inset: photograph of the fabricated NIR LED under natural light and the NIR light (with an 800 nm filter). (b) The driven current dependence of output powers and conversion efficiencies. (c) The electroluminescence spectrum fitted by the Gaussian formula.
Fig. 4. NIR applications of Te cluster-doped glass converted-LED device. (a) The working schematic of the NIR LED device. (b) Photographs of a flower, of a tomato, and of a succulent plant under natural light (left panels) and the NIR LED device (right panels). (c) The schematic diagram of the NIR LED biological penetration experiment. (d) The emission spectra of the NIR light after passing through different thicknesses of pork slices. Inset: the intensity ratio between the NIR LED emission after and before passing through pork slices as a function of the thicknesses of the pork slices. (e) The upper panel, calculated transmission spectra of the NIR LED light after passing through the different thicknesses of pork slices. The middle and lower panels, measured transmission spectra of the water and 1 mm pork slice, respectively.


Set citation alerts for the article
Please enter your email address

© Copyright 2018-2021 | Chinese Laser Press. All Rights Reserved 沪ICP备15018463号-20