
Linling Tan, Yanqing Fu, Shiliang Kang, Lothar Wondraczek, Changgui Lin, Yuanzheng Yue, "Broadband NIR-emitting Te cluster-doped glass for smart light source towards night-vision and NIR spectroscopy applications," Photonics Res. 10, 1187 (2022)
- Photonics Research
- Vol. 10, Issue 5, 1187 (2022)
Abstract
1. INTRODUCTION
Near-infrared (NIR) light with the ability to penetrate deep into organic tissue holds great promise for applications in the medical industry, bio-sensing, food processing, and night-vision technologies [1–3]. Smart NIR light sources could be combined with smart phones to enable convenient devices for NIR sensing and imaging [4,5]. Contrary to traditional NIR light sources such as tungsten halogen lamps and laser diodes, NIR light-emitting diodes (LEds) feature high efficiency and long lifetime, owing to their solid state and compact size, and thus may be used in smart NIR devices. However, the problem is that only a narrow emission bandwidth has been attained in NIR LEDs so far [6,7]. This limits their applications in bio-sensing and food analysis since the spectral characteristics of relevant organic molecules in foodstuffs or, e.g., biological tissues, cover a wide wavelength range [8,9]. Instead, a tunable broadband NIR light source is required. In this regard, NIR phosphors or glasses with tunable broadband emission combined with highly efficient and commercially available blue LED chips were found to be promising components for realizing a compact and low-cost broadband NIR light source [10,11].
The realization of such NIR light sources relies greatly on materials doped with rare-earth (
We note that Te-doped glasses with broadband luminescence have been developed in various types of glasses [20–22]. Unlike the above-mentioned single active ion-doped glasses, the broadband luminescence of Te-doped glasses arises from Te clusters (e.g.,
Sign up for Photonics Research TOC. Get the latest issue of Photonics Research delivered right to you!Sign up now
Recently, the topological cage concept has been proposed, by which NIR luminescent Te clusters in the silicate glass matrix can be stabilized, leading to ultra-broadband near-infrared emission in the spectral range of 700–1300 nm with an emission peak maximum at 900 nm [31]. If the size and configuration of the topological cage can be controlled, then new Te clusters will enable tunable NIR emission because those clusters selectively enter the topological cages with specific geometry, size, network modifier type, and network connectivity. Accordingly, topological cages of the germanate glass network can be adjusted by varying the
In this work, we demonstrate that Te-doped borate glass provides the required excitation performance under blue light illumination and exhibits broadband photoemission in the NIR spectral region from 700 to 1500 nm with a peak at 980 nm. We propose a strategy to tune cluster speciation and optimize the spectroscopic properties of Te cluster-doped glass by adjusting glass chemistry, processing conditions, and topological features of the glass matrix. By implementing a reducing atmosphere during glass melting, Te clusters can be stabilized in such materials, giving rise to the broadband photoluminescence. In this way, a tunable emission peak is obtained. Materials produced in this way can be used in glass-converted-LED devices, for example, for night-vision or NIR spectroscopy.
2. EXPERIMENT
A. Sample Preparation
All glasses samples were prepared by melt-quenching from analytical grade reagents
B. Material Characterization
Optical transmittance spectra were recorded on a Perkin Elmer Lambda-900 UV-Vis-NIR spectrophotometer over the spectral range of 200 to 3200 nm. Photoluminescence spectroscopy measurements (static excitation and emission spectra) were conducted on an Edinburgh FLS920 spectrofluorometer equipped with a static 450 W Xe lamp as excitation sources. Transmission electron microscopy (TEM) and high-resolution transmission microscopy (HRTEM) images were collected with a JEOL JEM-2100F microscope. Vibrational spectroscopic measurements were performed on a Renishaw InVia Raman spectrometer excited with a 532 nm laser at an output power of
3. RESULTS AND DISCUSSION
Borate glasses possess a broad variety of superstructural units such as boroxol, borate or diborate rings, metaborate rings or chains, and pyro- or orthoborate groups [33,34]. The fractions of these units can be adjusted by not only varying the type and fraction of network modifiers but also changing the melting condition and thermal history [34,35]. This provides an opportunity to control the topological environment of Te cluster species for tunable luminescence when these species are incorporated into the borate matrix. However, Te-related photoluminescence such as in silicate or phosphate matrices was not yet reported in this group of materials [36]. In the present work, the carbon-induced melt-reduction results in broad photoluminescence at 904 nm in the quenched glass [full-width at half-maximum (FWHM) of
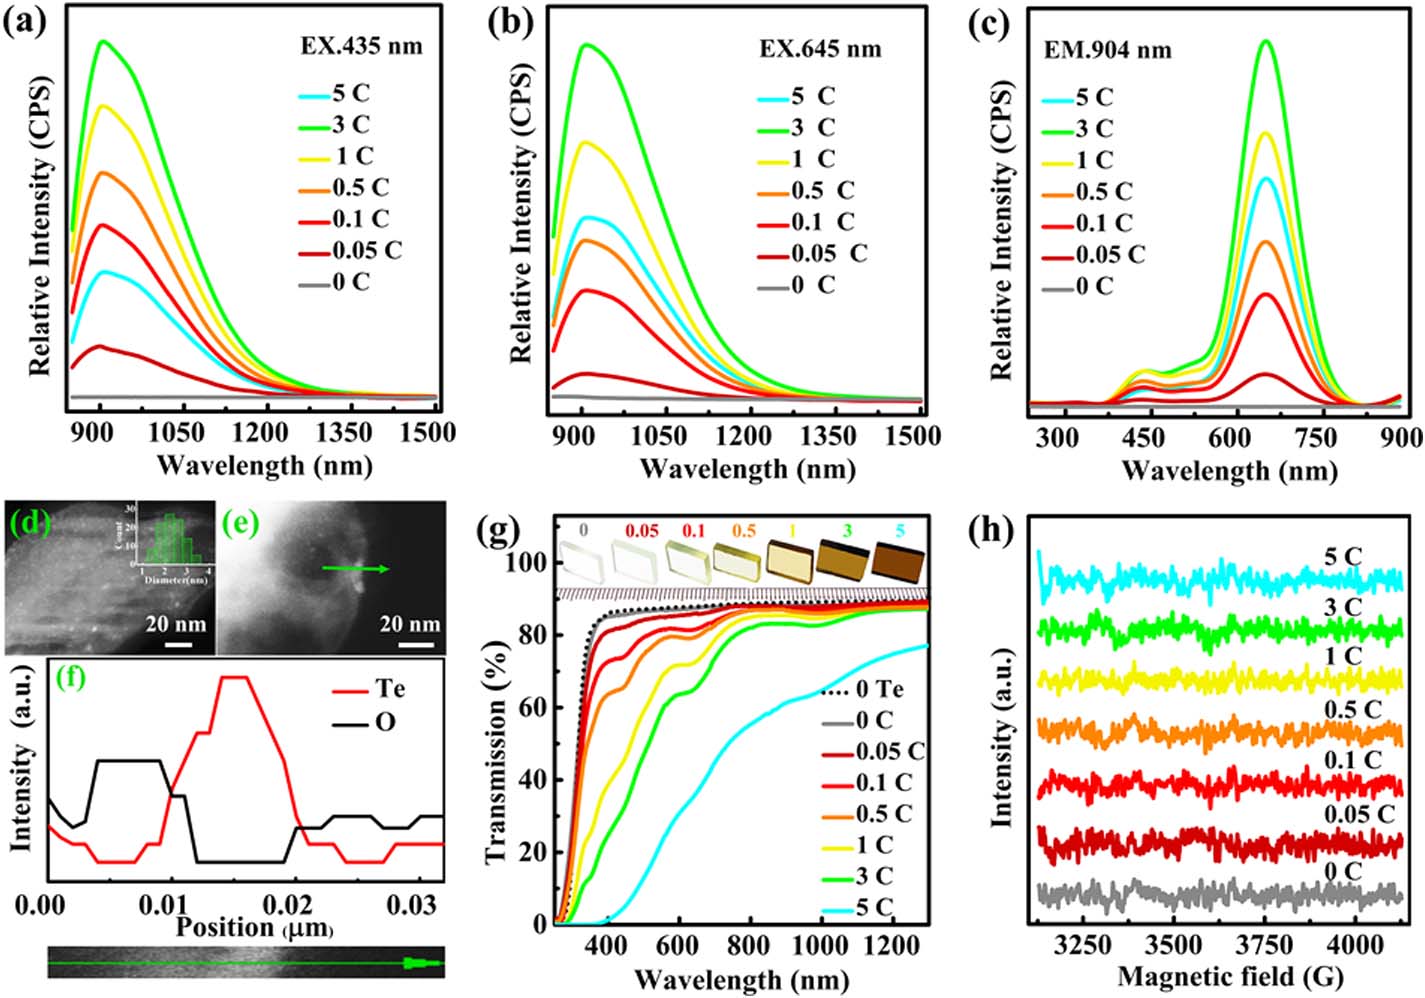
Figure 1.Occurrence and identification of Te clusters. Emission spectra upon (a) 435 nm and (b) 645 nm excitation. (c) The excitation spectra monitored at 904 nm of glass samples
TEM analysis on the glass B-3C indicates the presence of both the spherical Te particles with a diameter of
While the initial NIR photoluminescence spectra reveal only one single emission center, the transmission spectra of glasses with different amounts of added
By introducing network modifiers that possess less localized bonds with predominantly ionic bonds, compared to network formers, we can control the degree of network connectivity in oxide glasses. Alkali ions, particularly
![]()
Figure 2.Tunable luminescence behavior of Te clusters and manipulation of Te speciation through network modifiers. (a) The excitation spectra monitored at 904 nm. The emission spectra upon (b) 500 and (c) 435 nm excitation. (d) The Raman spectra and (e) the
The characteristics of the NIR emission can be tuned by tuning the Te speciation, as shown in Figs. 2(b) and 2(c). Upon 500 nm excitation, the emission intensity increases with
The Raman spectra of the
Boron speciation is quantified using
Based on the structure characterizations of the studied glasses, a mechanism for the evolution of the Te clusters is described in Fig. 2(g). This mechanism involves three aspects: 1) network topology related to rings and chains, 2) negatively charged environment due to the presence of non-bridged oxygen species (NBOs), and 3) local cation acidity due to variations in the presence of potassium. Increasing the fraction of network modifiers causes an increase in the number of NBOs, and thereby creates the negatively charged local environment. Thus, more positive charges are required for charge balance, leading to an increase in the valence state of Te. Then, the Te may be incorporated into the glass network in the form of
An NIR LED with a broadband NIR light source was fabricated by covering a commercial 460 nm LED chip with the Te-doped borate glass B-40K. When the NIR LED is lit, images of the NIR LED were obtained using an NIR camera with and without an 800 nm filter, respectively [inset of Fig. 3(a)]. The electroluminescence spectrum of the NIR LED under different driving currents shows a super broadband NIR emission peaking at 980 nm [Fig. 3(a)]. The NIR emission output power increases with increasing current and reaches 22.25 mW in the NIR region at
![]()
Figure 3.Electroluminescence performance of Te cluster-doped glass converted-LED device. (a) The electroluminescence spectra of the as-fabricated NIR LED based on B-40K under different driven currents. Inset: photograph of the fabricated NIR LED under natural light and the NIR light (with an 800 nm filter). (b) The driven current dependence of output powers and conversion efficiencies. (c) The electroluminescence spectrum fitted by the Gaussian formula.
An NIR LED device was assembled by covering a long wave-pass filter (800 nm) on the NIR LED, as illustrated in Fig. 4(a). Figure 4(b) shows photographs of a flower, of a tomato, and of a succulent plant, which were taken under natural light and the NIR LED device light, implying a potential application of the Te cluster-doped borate glass in night-vision technology. Compared with other kinds of NIR light sources, the NIR emission peak at 980 nm has a higher relative intensity, and its position is much closer to those of the absorption peaks of common chemical bonds. This holds the promise of less noise and interference for higher detection sensitivity. For demonstration, we used raw slices of pork tissue [Fig. 4(c)]. For this, the NIR LED device was covered by a slice of the tissue. The thickness of the slice was varied between tests so that the net NIR emission intensity was recorded as a function of cover thickness. Figure 4(d) shows that the luminescence is partly absorbed in the raw pork tissue. The emission intensity decreases to 40% when the pork thickness increases from 0 to 1 mm and decreases further to 2% for the 30 mm slice [Inset of Fig. 4(d)], indicating the degree of tissue penetration. Transmission spectra of the NIR LED light after passing through the different layers of tissue slices are shown in the upper panel of Fig. 4(e). The shape of the calculated transmission spectra is different from that of the water measured by the UV-Vis-NIR spectrometer [middle panel in Fig. 4(e)], especially for the intensity ratio of the absorption band at 980 nm band to that at 1180 nm for the 1 mm pork slice with lower water content. Assumedly, even a weak absorption at 980 nm measured by the UV-Vis-NIR spectrometer could be detected [lower panel of Fig. 4(e)], since the Te cluster-doped glass exhibits strong emission intensity around 980 nm, which contributes to the high detection sensitivity.
![]()
Figure 4.NIR applications of Te cluster-doped glass converted-LED device. (a) The working schematic of the NIR LED device. (b) Photographs of a flower, of a tomato, and of a succulent plant under natural light (left panels) and the NIR LED device (right panels). (c) The schematic diagram of the NIR LED biological penetration experiment. (d) The emission spectra of the NIR light after passing through different thicknesses of pork slices. Inset: the intensity ratio between the NIR LED emission after and before passing through pork slices as a function of the thicknesses of the pork slices. (e) The upper panel, calculated transmission spectra of the NIR LED light after passing through the different thicknesses of pork slices. The middle and lower panels, measured transmission spectra of the water and 1 mm pork slice, respectively.
4. CONCLUSIONS
A series of luminescent, tunable NIR-emitting Te cluster-doped borate glasses with a super-broad excitation band from 250 to 850 nm were designed and synthesized. Upon blue light excitation, the Te cluster-doped glass was used to generate an ultra-broadband emission centered at 980 nm with a large FWHM of 306 nm. By manipulating glass chemistry, processing, and topological features of the glass matrix, we were able to tailor active Te cluster centers, and thereby achieved the tunable NIR emission peak with a center position varying from 904 to 1026 nm. The spectral region of this peak matches the location of the stretching vibrations of the common chemical bonds in water, protein, and fats.
References
[1] A. T. Eggebrecht, S. L. Ferradal, A. Robichaux-Viehoever, M. S. Hassanpour, H. Dehghani, A. Z. Snyder, T. Hershey, J. P. Culver. Mapping distributed brain function and networks with diffuse optical tomography. Nat. Photonics, 8, 448-454(2014).
[2] B. Zeng, Z. Huang, A. Singh, Y. Yao, A. K. Azad, A. D. Mohite, A. J. Taylor, D. R. Smith, H.-T. Chen. Hybrid graphene metasurfaces for high-speed mid-infrared light modulation and single-pixel imaging. Light Sci. Appl., 7, 51(2018).
[3] K. T. Ly, R.-W. Chen-Cheng, H.-W. Lin, Y.-J. Shiau, S.-H. Liu, P.-T. Chou, C.-S. Tsao, Y.-C. Huang, Y. Chi. Near-infrared organic light-emitting diodes with very high external quantum efficiency and radiance. Nat. Photonics, 11, 63-68(2017).
[4] A. Zampetti, A. Minotto, F. Cacialli. Near-infrared (NIR) organic light-emitting diodes (OLEDs): challenges and opportunities. Adv. Funct. Mater., 29, 1807623(2019).
[5] C. Dincer, R. Bruch, E. Costa-Rama, M. T. Fernández-Abedul, A. Merkoçi, A. Manz, G. A. Urban, F. Güder. Disposable sensors in diagnostics, food, and environmental monitoring. Adv. Mater., 31, 1806739(2019).
[6] R. Filippo, E. Taralli, M. Rajteri. LEDs: sources and intrinsically bandwidth-limited detectors. Sensors, 17, 1673(2017).
[7] X. Zhao, Z.-K. Tan. Large-area near-infrared perovskite light-emitting diodes. Nat. Photonics, 14, 215-218(2020).
[8] Y. Dixit, M. P. Casado-Gavalda, R. Cama-Moncunill, X. Cama-Moncunill, M. Markiewicz-Keszycka, P. J. Cullen, C. Sullivan. Developments and challenges in online NIR spectroscopy for meat processing. Compr. Rev. Food Sci. Food Saf., 16, 1172-1187(2017).
[9] F. F. Jöbsis. Noninvasive, infrared monitoring of cerebral and myocardial oxygen sufficiency and circulatory parameters. Science, 198, 1264-1267(1977).
[10] G. N. A. De Guzman, S. F. Hu, R. S. Liu. Enticing applications of near-infrared phosphors: review and future perspectives. J. Chin. Chem. Soc., 68, 206-215(2021).
[11] L. Zhang, D. Wang, Z. Hao, X. Zhang, G.-H. Pan, H. Wu, J. Zhang. Cr3+-doped broadband NIR garnet phosphor with enhanced luminescence and its application in NIR spectroscopy. Adv. Opt. Mater., 7, 1900185(2019).
[12] J. Chen, C. Guo, Z. Yang, T. Li, J. Zhao. Li2SrSiO4:Ce3+, Pr3+ phosphor with blue, red, and near-infrared emissions used for plant growth LED. J. Am. Ceram. Soc., 99, 218-225(2016).
[13] A. Benayas, B. del Rosal, A. Pérez-Delgado, K. Santacruz-Gómez, D. Jaque, G. A. Hirata, F. Vetrone. Nd:YAG near-infrared luminescent nanothermometers. Adv. Opt. Mater., 3, 687-694(2015).
[14] M. Nyk, R. Kumar, T. Y. Ohulchanskyy, E. J. Bergey, P. N. Prasad. High contrast
[15] E. T. Basore, H. Wu, W. Xiao, G. Zheng, X. Liu, J. Qiu. High-power broadband NIR LEDs enabled by highly efficient blue-to-NIR conversion. Adv. Opt. Mater., 9, 2001660(2021).
[16] Z. Liao, H. Xu, W. Zhao, H. Yang, J. Zhong, H. Zhang, Z. Nie, Z.-K. Zhou. Energy transfer from Mn4+ to Mn5+ and near infrared emission with wide excitation band in Ca14Zn6Ga10O35:Mn phosphors. Chem. Eng. J., 395, 125060(2020).
[17] F. Liu, Y. Liang, Y. Chen, Z. Pan. Divalent nickel-activated gallate-based persistent phosphors in the short-wave infrared. Adv. Opt. Mater., 4, 562-566(2016).
[18] M.-H. Fang, P.-Y. Huang, Z. Bao, N. Majewska, T. Leśniewski, S. Mahlik, M. Grinberg, G. Leniec, S. M. Kaczmarek, C.-W. Yang, K.-M. Lu, H.-S. Sheu, R.-S. Liu. Penetrating biological tissue using light-emitting diodes with a highly efficient near-infrared ScBO3:Cr3+ phosphor. Chem. Mater., 32, 2166-2171(2020).
[19] Z. Jia, C. Yuan, Y. Liu, X.-J. Wang, P. Sun, L. Wang, H. Jiang, J. Jiang. Strategies to approach high performance in Cr3+-doped phosphors for high-power NIR-LED light sources. Light Sci. Appl., 9, 86(2020).
[20] P. Penprapa. Nir Luminescence Characteristics of Te-Doped Glasses(2009).
[21] E. M. Dianov, S. V. Alyshev, A. V. Shubin, V. F. Khopin, A. N. Gur’yanov. IR luminescence of tellurium-doped silica-based optical fibre. Quantum Electron., 42, 189-191(2012).
[22] L. Tan, S. Kang, Z. Pan, Y. Zhang, Y. Yue, S. Xu, M. Peng, L. Wondraczek. Topo-chemical tailoring of tellurium quantum dot precipitation from supercooled polyphosphates for broadband optical amplification. Adv. Opt. Mater., 4, 1624-1634(2016).
[23] S. Khonthon, S. Morimoto, Y. Arai, Y. Ohishi. Luminescence characteristics of Te- and Bi-doped glasses and glass-ceramics. J. Ceram. Soc. Jpn., 115, 259-263(2007).
[24] H.-T. Sun, Y. Sakka, N. Shirahata, M. Fujii, T. Yonezawa. Near-infrared photoluminescence from molecular crystals containing tellurium. J. Mater. Chem., 22, 24792-24797(2012).
[25] L. Tan, J. C. Mauro, S. Xu, Z. Yang, M. Peng. Unusual thermal response of tellurium near-infrared luminescence in phosphate laser glass. Opt. Lett., 43, 4823-4826(2018).
[26] H. Wu, X. He, B. Yang, C.-C. Li, L. Zhao. Assembly-induced strong circularly polarized luminescence of spirocyclic chiral silver(I) clusters. Angew. Chem. Int. Ed., 60, 1535-1539(2021).
[27] W.-M. He, Z. Zhou, Z. Han, S. Li, Z. Zhou, L.-F. Ma, S.-Q. Zang. Ultrafast size expansion and turn-on luminescence of atomically precise silver clusters by hydrogen sulfide. Angew. Chem. Int. Ed., 60, 8505-8509(2021).
[28] B. C. Pan. Geometric structures, electronic properties, and vibrational frequencies of small tellurium clusters. Phys. Rev. B, 65, 085407(2002).
[29] G.-G. Lindner, K. Witke, H. Schlaich, D. Reinen. Blue-green ultramarine-type zeolites with dimeric tellurium colour centres. Inorg. Chim. Acta, 252, 39-45(1996).
[30] J. Beck. Rings, cages and chains—the rich structural chemistry of the polycations of the chalcogens. Coord. Chem. Rev., 163, 55-70(1997).
[31] L. Tan, L. Huang, M. Peng. D2h-symmetric tetratellurium clusters in silicate glass as a broadband NIR light source for spectroscopy applications. ACS Appl. Mater. Interface, 12, 51628-51636(2020).
[32] L. Tan, L. Huang, C. He, J. C. Mauro, M. Peng, X.-B. Yang, Y. Yue. Tailoring cluster configurations enables tunable broad-band luminescence in glass. Chem. Mater., 32, 8653-8661(2020).
[33] W. L. Konijnendijk. The structure of borosilicate glasses(1975).
[34] D. Möncke, E. I. Kamitsos, D. Palles, R. Limbach, A. Winterstein-Beckmann, T. Honma, Z. Yao, T. Rouxel, L. Wondraczek. Transition and post-transition metal ions in borate glasses: borate ligand speciation, cluster formation, and their effect on glass transition and mechanical properties. J. Chem. Phys., 145, 124501(2016).
[35] Z. Y. Yao, D. Möncke, E. I. Kamitsos, P. Houizot, F. Célarié, T. Rouxel, L. Wondraczek. Structure and mechanical properties of copper-lead and copper-zinc borate glasses. J. Non-Cryst. Solids, 435, 55-68(2016).
[36] S. Khonthon, P. Punpai, S. Morimoto, Y. Arai, T. Suzuki, Y. Ohishi. On the near-infrared luminescence from TeO2 containing borate glasses. J. Ceram. Soc. Jpn., 116, 829-831(2008).
[37] P. Hassanzadeh, C. Thompson, L. Andrews. Absorption spectra of tellurium clusters in solid argon. J. Chem. Phys., 96, 8246-8249(1992).
[38] S. V. Alyshev, K. E. Ryumkin, A. V. Shubin, O. I. Medvedkov, E. M. Dianov, V. F. Khopin, A. N. Gur’yanov. Fibre laser based on tellurium-doped active fibre. Quantum Electron., 44, 95-97(2014).
[39] G. D. Chryssikos, E. I. Kamitsos, A. P. Patsis, M. A. Karakassides. On the structure of alkali borate glasses approaching the orthoborate composition. Mater. Sci. Eng. B, 7, 1-4(1990).
[40] C. Calahoo, L. Wondraczek. Ionic glasses: structure, properties and classification. J. Non-Cryst. Solids X, 8, 100054(2020).
[41] B. N. Meera, A. K. Sood, N. Chandrabhas, J. Ramakrishna. Raman study of lead borate glasses. J. Non-Cryst. Solids, 126, 224-230(1990).
[42] V. V. Poborchii. Polarized Raman and optical absorption spectra of the mordenite single crystals containing sulfur, selenium, or tellurium in the one-dimensional nanochannels. Chem. Phys. Lett., 251, 230-234(1996).
[43] L. Koudelka, I. Rösslerová, Z. Černošek, P. Mošner, L. Montagne, B. Revel. The structural role of tellurium dioxide in lead borophosphate glasses. J. Non-Cryst. Solids, 401, 124-128(2014).
[44] L. Wondraczek, S. Sen, H. Behrens, R. E. Youngman. Structure-energy map of alkali borosilicate glasses: effects of pressure and temperature. Phys. Rev. B, 76, 014202(2007).


Set citation alerts for the article
Please enter your email address

© Copyright 2018-2021 | Chinese Laser Press. All Rights Reserved 沪ICP备15018463号-20