• Chinese Journal of Lasers
  • Vol. 48, Issue 11, 1109001 (2021)
Tingting Wei1, Jiazhi Yang1、*, Guoqing Zhou2, Xiang Zhou2、3, and Xueqin Nong4
Author Affiliations
  • 1College of Information Science and Engineering, Guilin University of Technology, Guilin, Guangxi 541006, China
  • 2Guangxi Key Laboratory of Spatial Information and Geomatics, Guilin University of Technology, Guilin, Guangxi 541006, China
  • 3School of Microelectronics, Tianjin University, Tianjin 300072, China
  • 4The 34th Research Institute of China Electronics Technology Group Corporation, Guilin, Guangxi 541004, China
  • show less
    DOI: 10.3788/CJL202148.1109001 Cite this Article Set citation alerts
    Tingting Wei, Jiazhi Yang, Guoqing Zhou, Xiang Zhou, Xueqin Nong. Shallow-Water LiDAR Echo Signal Denoising Based on Improved EWT[J]. Chinese Journal of Lasers, 2021, 48(11): 1109001 Copy Citation Text show less
    Flow chart of improved EWT algorithm
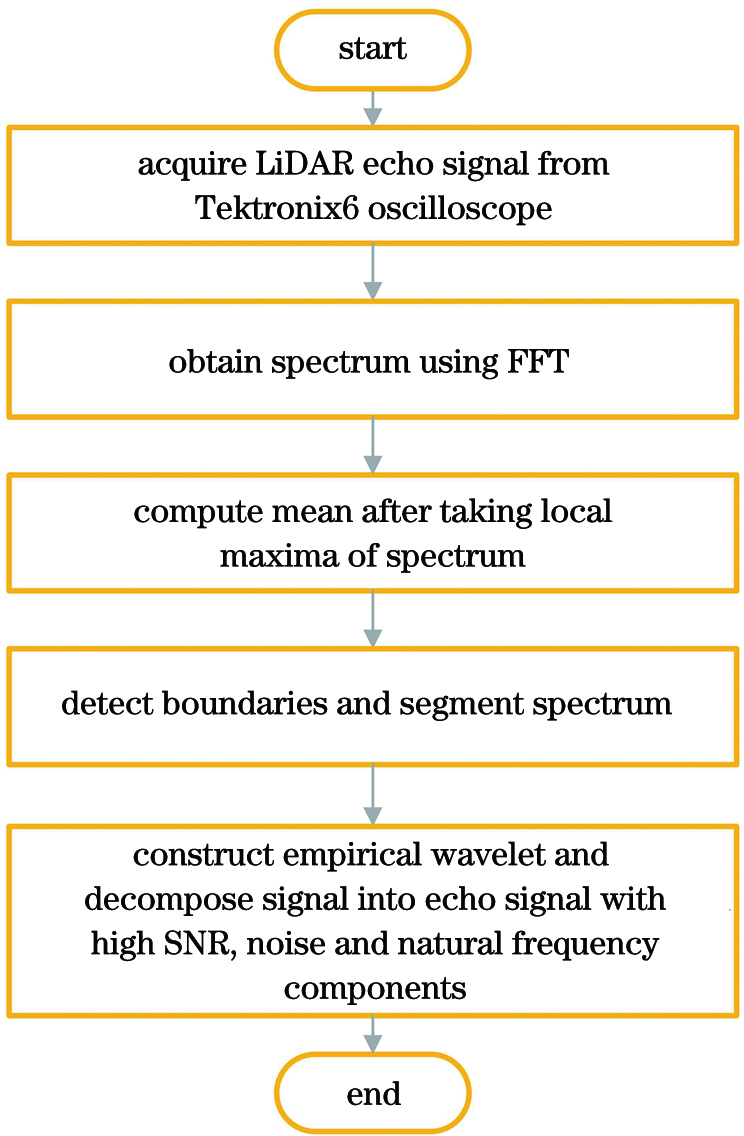
    Fig. 1. Flow chart of improved EWT algorithm
    Shallow-water LiDAR echo signal model. (a) Echo signal without noise; (b) echo signal with Gaussian white noise (SNR is 20 dB)
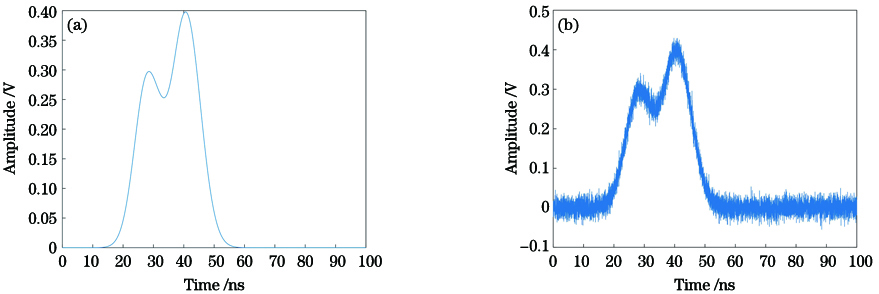
    Fig. 2. Shallow-water LiDAR echo signal model. (a) Echo signal without noise; (b) echo signal with Gaussian white noise (SNR is 20 dB)
    Processing results of signal model using improved EWT. (a) Signal with noise and its EMFs (SNR is 20 dB); (b) comparison of signal with noise before and after denosing
    Fig. 3. Processing results of signal model using improved EWT. (a) Signal with noise and its EMFs (SNR is 20 dB); (b) comparison of signal with noise before and after denosing
    Shallow-water LiDAR experimental system. (a) Principle diagram; (b) practical map
    Fig. 4. Shallow-water LiDAR experimental system. (a) Principle diagram; (b) practical map
    Measured waveforms under different water depths. (a) ΔdL1=2.127 m; (b) ΔdL1=1.621 m; (c) ΔdL1=1.434 m; (d) ΔdL1= 0.774 m
    Fig. 5. Measured waveforms under different water depths. (a) ΔdL1=2.127 m; (b) ΔdL1=1.621 m; (c) ΔdL1=1.434 m; (d) ΔdL1= 0.774 m
    Denoised waveforms under different water depths. (a) ΔdL1=2.127 m; (b) ΔdL1=1.621 m;(c) ΔdL1=1.434 m; (d) ΔdL1= 0.774 m
    Fig. 6. Denoised waveforms under different water depths. (a) ΔdL1=2.127 m; (b) ΔdL1=1.621 m;(c) ΔdL1=1.434 m; (d) ΔdL1= 0.774 m
    Spectral segmentation under different boundary detect methods. (a) LocalMax; (b) LocalMaxMin; (c) Scalespace; (d) improved EWT
    Fig. 7. Spectral segmentation under different boundary detect methods. (a) LocalMax; (b) LocalMaxMin; (c) Scalespace; (d) improved EWT
    EMFs under different boundary detect methods. (a) LocalMax; (b) LocalMaxMin; (c) Scalespace; (d) improved EWT
    Fig. 8. EMFs under different boundary detect methods. (a) LocalMax; (b) LocalMaxMin; (c) Scalespace; (d) improved EWT
    Bathymetric errors of different denoising methods
    Fig. 9. Bathymetric errors of different denoising methods
    Type of denoising algorithmDenoising algorithmMSE /mMAE /mSNR /dBPSNR /dBT /sCrosscorrelation
    WTSoft thresholding0.3970.47819.70629.7731.0100.993
    Hard thresholding0.3630.46820.09730.1641.0400.993
    Fixed thresholding0.6880.62517.32127.3881.1500.987
    EMD0.3060.39320.84330.9091.3000.995
    EEMD0.3210.43420.63430.7013.8900.994
    CEEMDAN0.2160.35922.35032.4175.7610.996
    Type of denoising algorithmDenoising algorithmMSE /mMAE /mSNR /dBPSNR /dBT /sCrosscorrelation
    EWTLocalMax0.8670.75416.31526.3820.5900.988
    LocMaxMin1.0450.85415.50425.5710.5100.981
    Scalespace0.2880.43821.09331.1590.7700.994
    Improved EWT0.1830.32623.07133.1380.5600.997
    Table 1. Comparison of denoising performance parameters
    Denoising methodGroupSurface echoBottom echoΔdL2 /mΔdL1 /m
    Position /nsHeight /VWidth /nsPosition /nsHeight /VWidth /ns
    CEEMDAN119.1000.3221.99538.1550.4902.1272.1492.127
    218.3010.1861.64732.0100.2382.3751.5461.621
    318.1360.4083.77430.3420.6064.6971.3761.434
    415.8550.2582.07222.7670.3292.4800.7760.774
    LocalMax boundary detect method123.6720.4806.50242.0010.4005.6732.0672.127
    224.0680.0984.84533.2560.1684.1171.0361.621
    318.5930.4733.84129.0670.5942.7491.1811.434
    416.0480.3211.88122.5850.8612.5000.7370.774
    Denoising methodGroupSurface echoBottom echoΔdL2 /mΔdL1 /m
    Position /nsHeight /VWidth /nsPosition /nsHeight /VWidth /ns
    Improved EWT method122.7080.4455.00340.6840.5275.1362.0272.127
    219.4670.1512.69833.9920.2313.1951.6381.621
    315.5630.4462.25828.7260.6442.3791.4841.434
    416.0840.3862.11022.2840.8482.7770.6990.774
    Table 2. Echo signal decomposition
    Tingting Wei, Jiazhi Yang, Guoqing Zhou, Xiang Zhou, Xueqin Nong. Shallow-Water LiDAR Echo Signal Denoising Based on Improved EWT[J]. Chinese Journal of Lasers, 2021, 48(11): 1109001
    Download Citation