
Zhenhong Wang, Bin Zhang, Bing Hu, Zhongjun Li, Chunyang Ma, Yu Chen, Yufeng Song, Han Zhang, Jun Liu, Guohui Nie. Two-dimensional tin diselenide nanosheets pretreated with an alkaloid for near- and mid-infrared ultrafast photonics[J]. Photonics Research, 2020, 8(11): 1687
- Photonics Research
- Vol. 8, Issue 11, 1687 (2020)
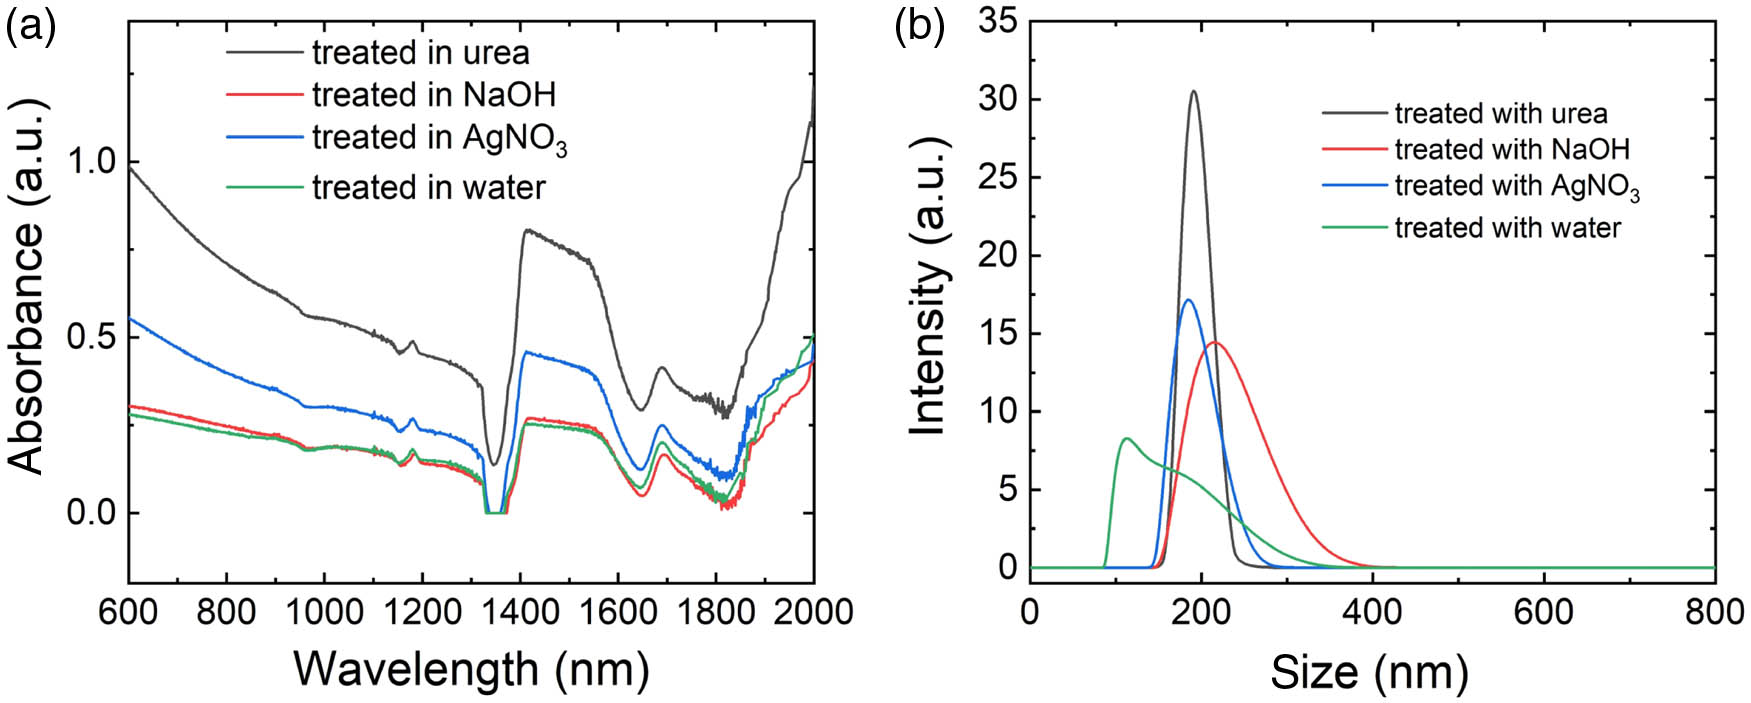
Fig. 1. Screening of pretreatment procedures. (a) Absorption spectra and (b) dynamic light scattering (DLS) spectra of a 0.01 mg/mL Sn Se 2
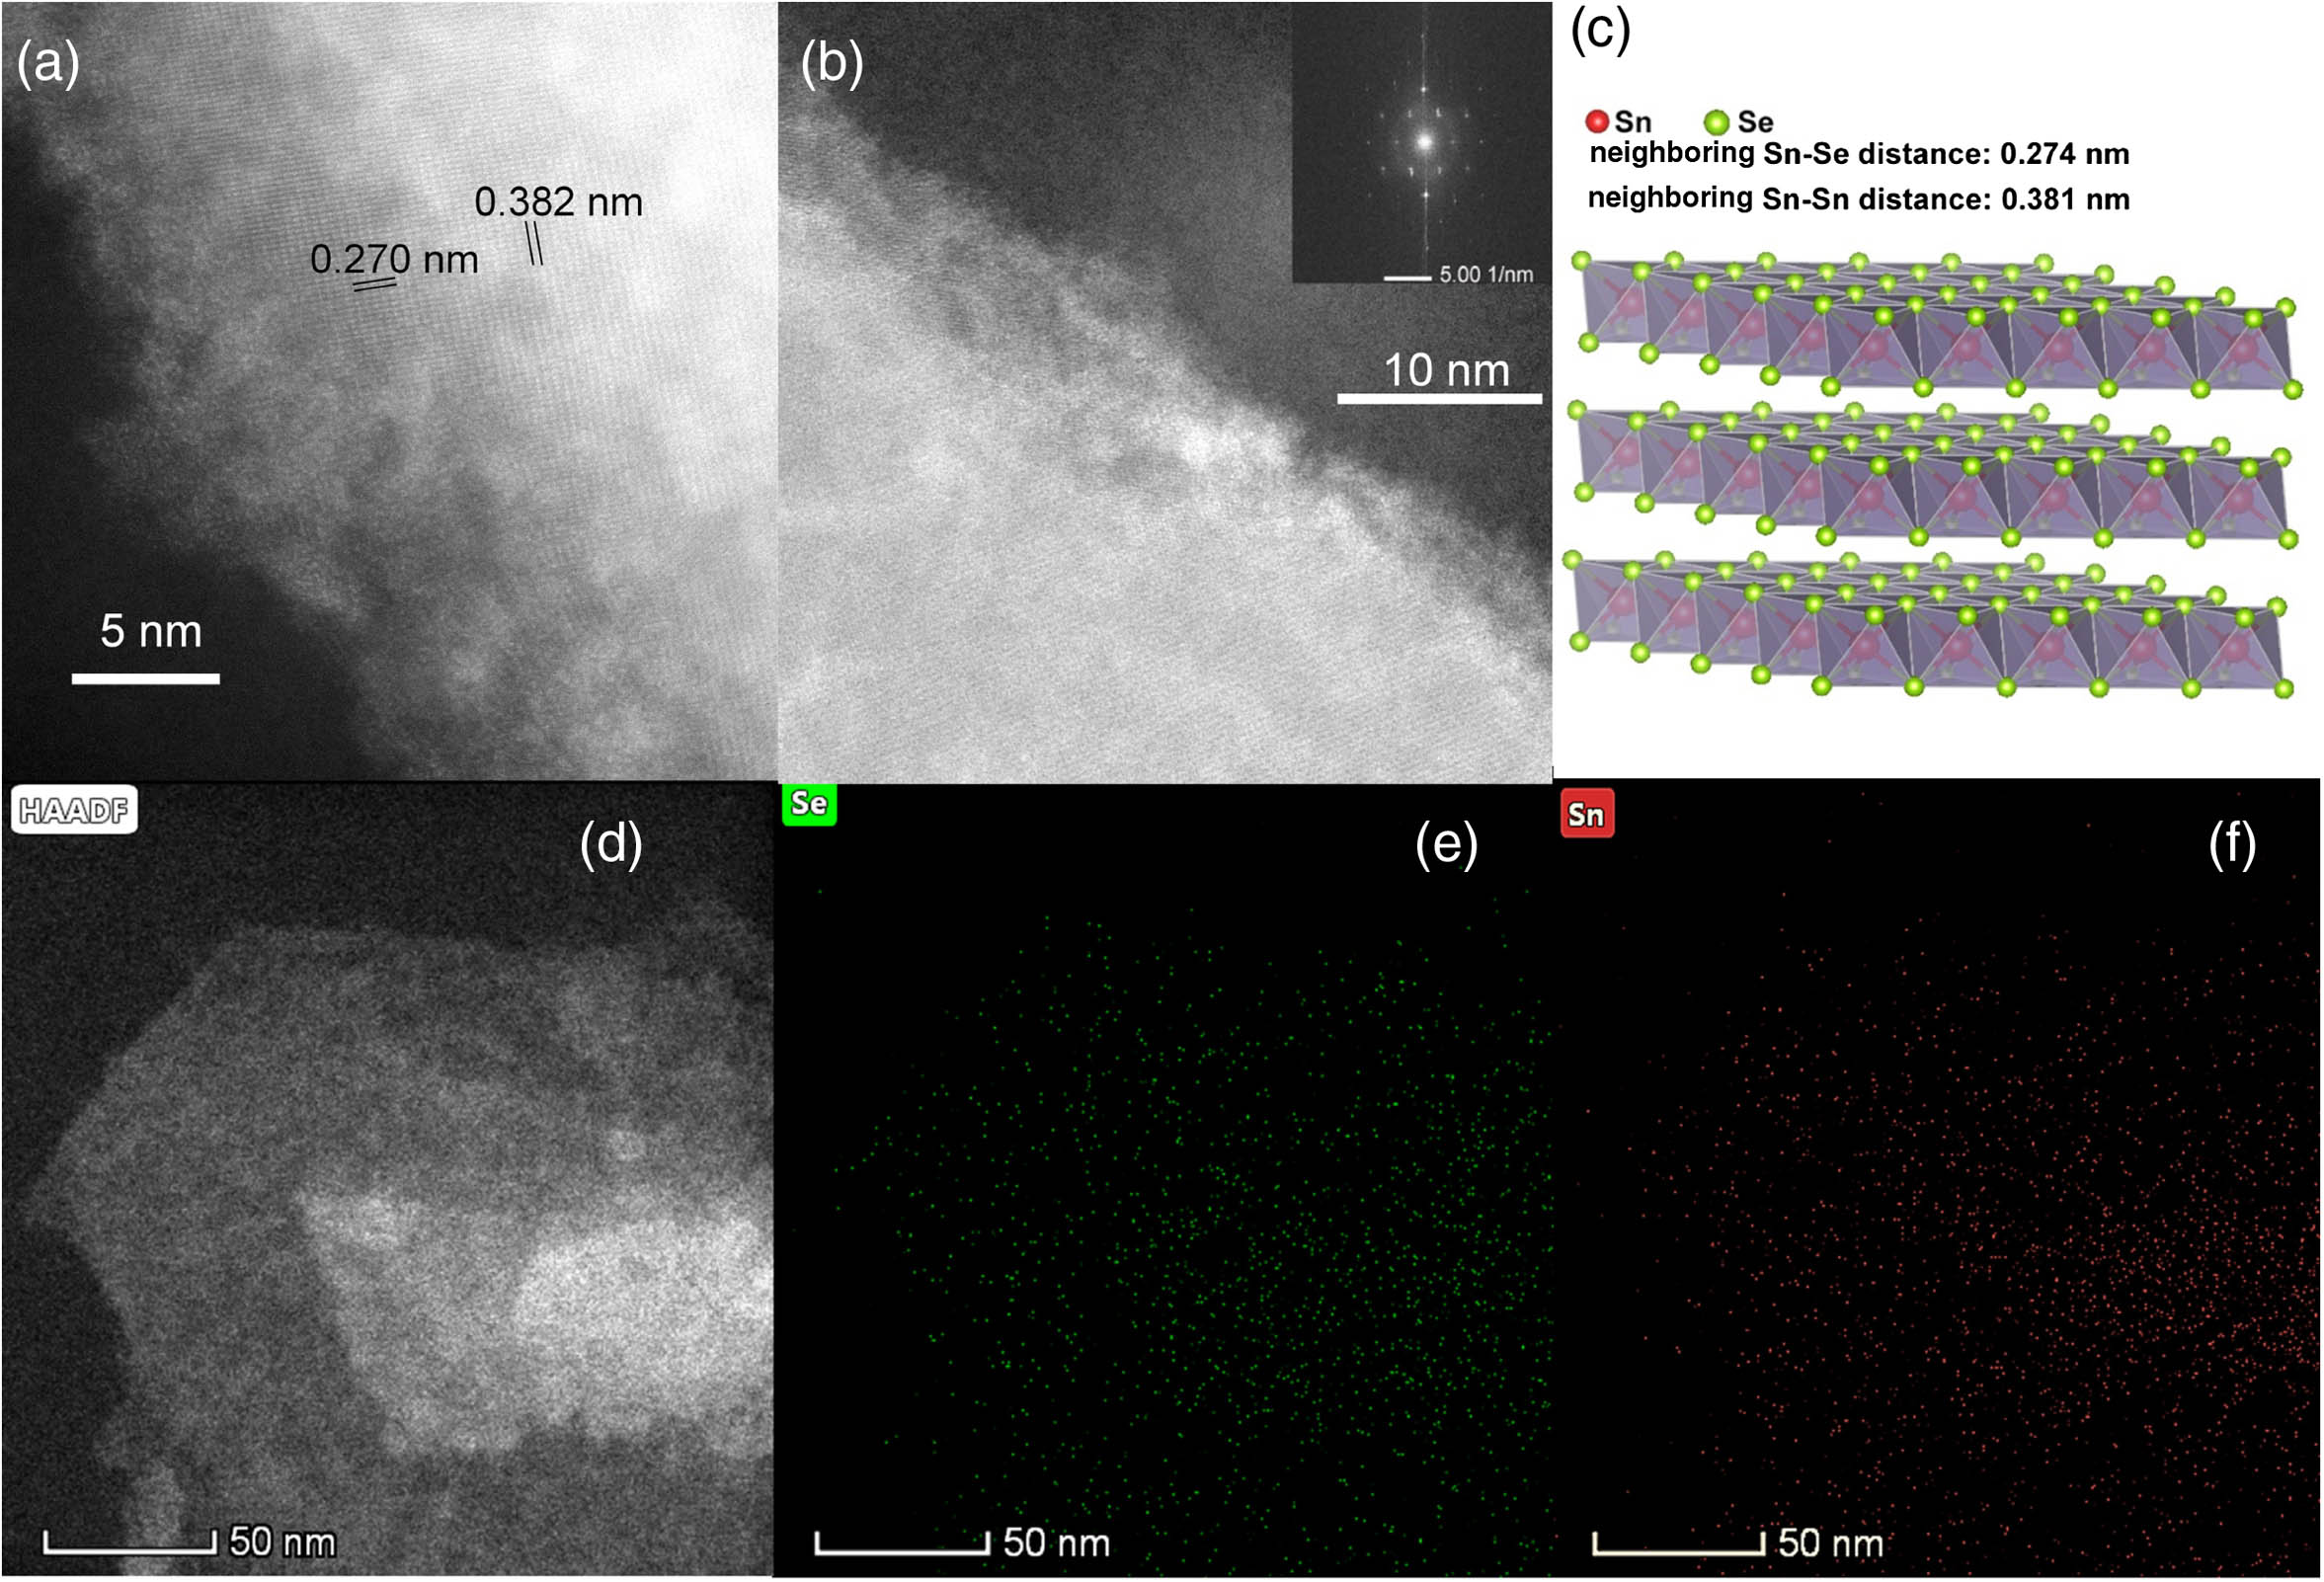
Fig. 2. (a), (b) HAADF-STEM images, (c) crystal model, (d)–(f) EDXS results of Sn Se 2
Fig. 3. (a)–(c) XPS profiles and (d) Raman spectrum of Sn Se 2
Fig. 4. NOPs of Sn Se 2
Fig. 5. Schematic diagram of the typical mode-locked fiber laser (for EDFL or TDFL).
Fig. 6. Stable ultrashort pulse operation: (a) optical spectrum, (b) oscilloscope trace, (c) autocorrelation trace, and (d) frequency spectrum.
Fig. 7. Chaotic multiple pulse operation: (a) optical spectrum, (b) high-speed oscilloscope trace (inset: low-speed oscilloscope trace), (c) enlarged view of the selected dashed part in (b), and (d) statistical histogram.
Fig. 8. Evolution of chaotic multiple pulses.
Fig. 9. Intensity histograms of chaotic pulses at (a) 500 mW and (b) 600 mW.
Fig. 10. Chaotic multiple pulse operation at 200 mW: (a) optical spectrum, (b) high-speed oscilloscope trace, (c) enlarged view of the selected dashed part in (b), and (d) statistical histogram.
Fig. 11. Output performance of the TDFL with a Sn Se 2
Fig. 12. Graphical comparison of TDFL with different 2D materials.
|
Table 1. Output Results of the 2 μm Fiber Lasers Based on Different 2D Material SAs

Set citation alerts for the article
Please enter your email address
© Copyright 2018-2021 | Chinese Laser Press. All Rights Reserved 沪ICP备15018463号-20