• Photonics Research
  • Vol. 9, Issue 12, 2369 (2021)
Yao Tong1, Qin Wang1, Heng Yang2, Xiaoting Liu1, Enrou Mei1, Xiaojuan Liang1、3, Zhijun Zhang2、4, and Weidong Xiang1、*
Author Affiliations
  • 1College of Chemistry and Materials Engineering, Wenzhou University, Wenzhou 325035, China
  • 2School of Materials Science and Engineering, Shanghai University, Shanghai 200444, China
  • 3e-mail: lxj6126@126.com
  • 4e-mail: zhangzhijun@shu.edu.cn
  • show less
    DOI: 10.1364/PRJ.439744 Cite this Article Set citation alerts
    Yao Tong, Qin Wang, Heng Yang, Xiaoting Liu, Enrou Mei, Xiaojuan Liang, Zhijun Zhang, Weidong Xiang. Enhanced multimodal luminescence and ultrahigh stability Eu3+-doped CsPbBr3 glasses for X-ray detection and imaging[J]. Photonics Research, 2021, 9(12): 2369 Copy Citation Text show less
    Schematic illustration of the in situ crystallization process of CsPbBr3 NCs in borosilicate glass.
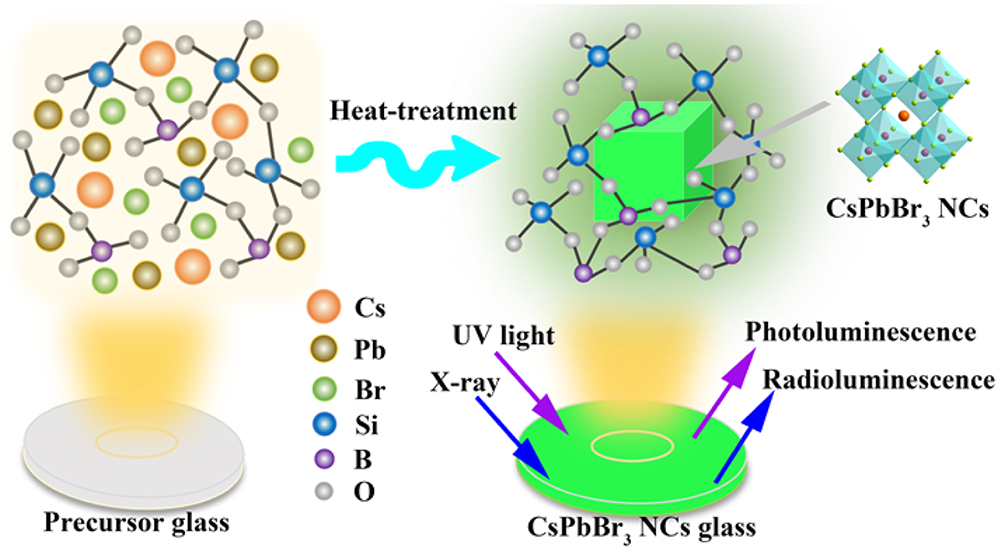
    Fig. 1. Schematic illustration of the in situ crystallization process of CsPbBr3 NCs in borosilicate glass.
    (a) XRD patterns of CPB-0Eu at different heat-treatment temperatures. (b) TEM image of CPB-0Eu at 520°C for 10 h. (c) PL spectra under UV light excitation of CPB-0Eu at different heat-treatment temperatures. (d) HRTEM image of CPB-0Eu at 520°C for 10 h. (e) Standard structure model diagram of CsPbX3 NCs. (f) Absorption spectra and (g) time-resolved PL decay profiles of CPB-0Eu at different heat-treatment temperatures.
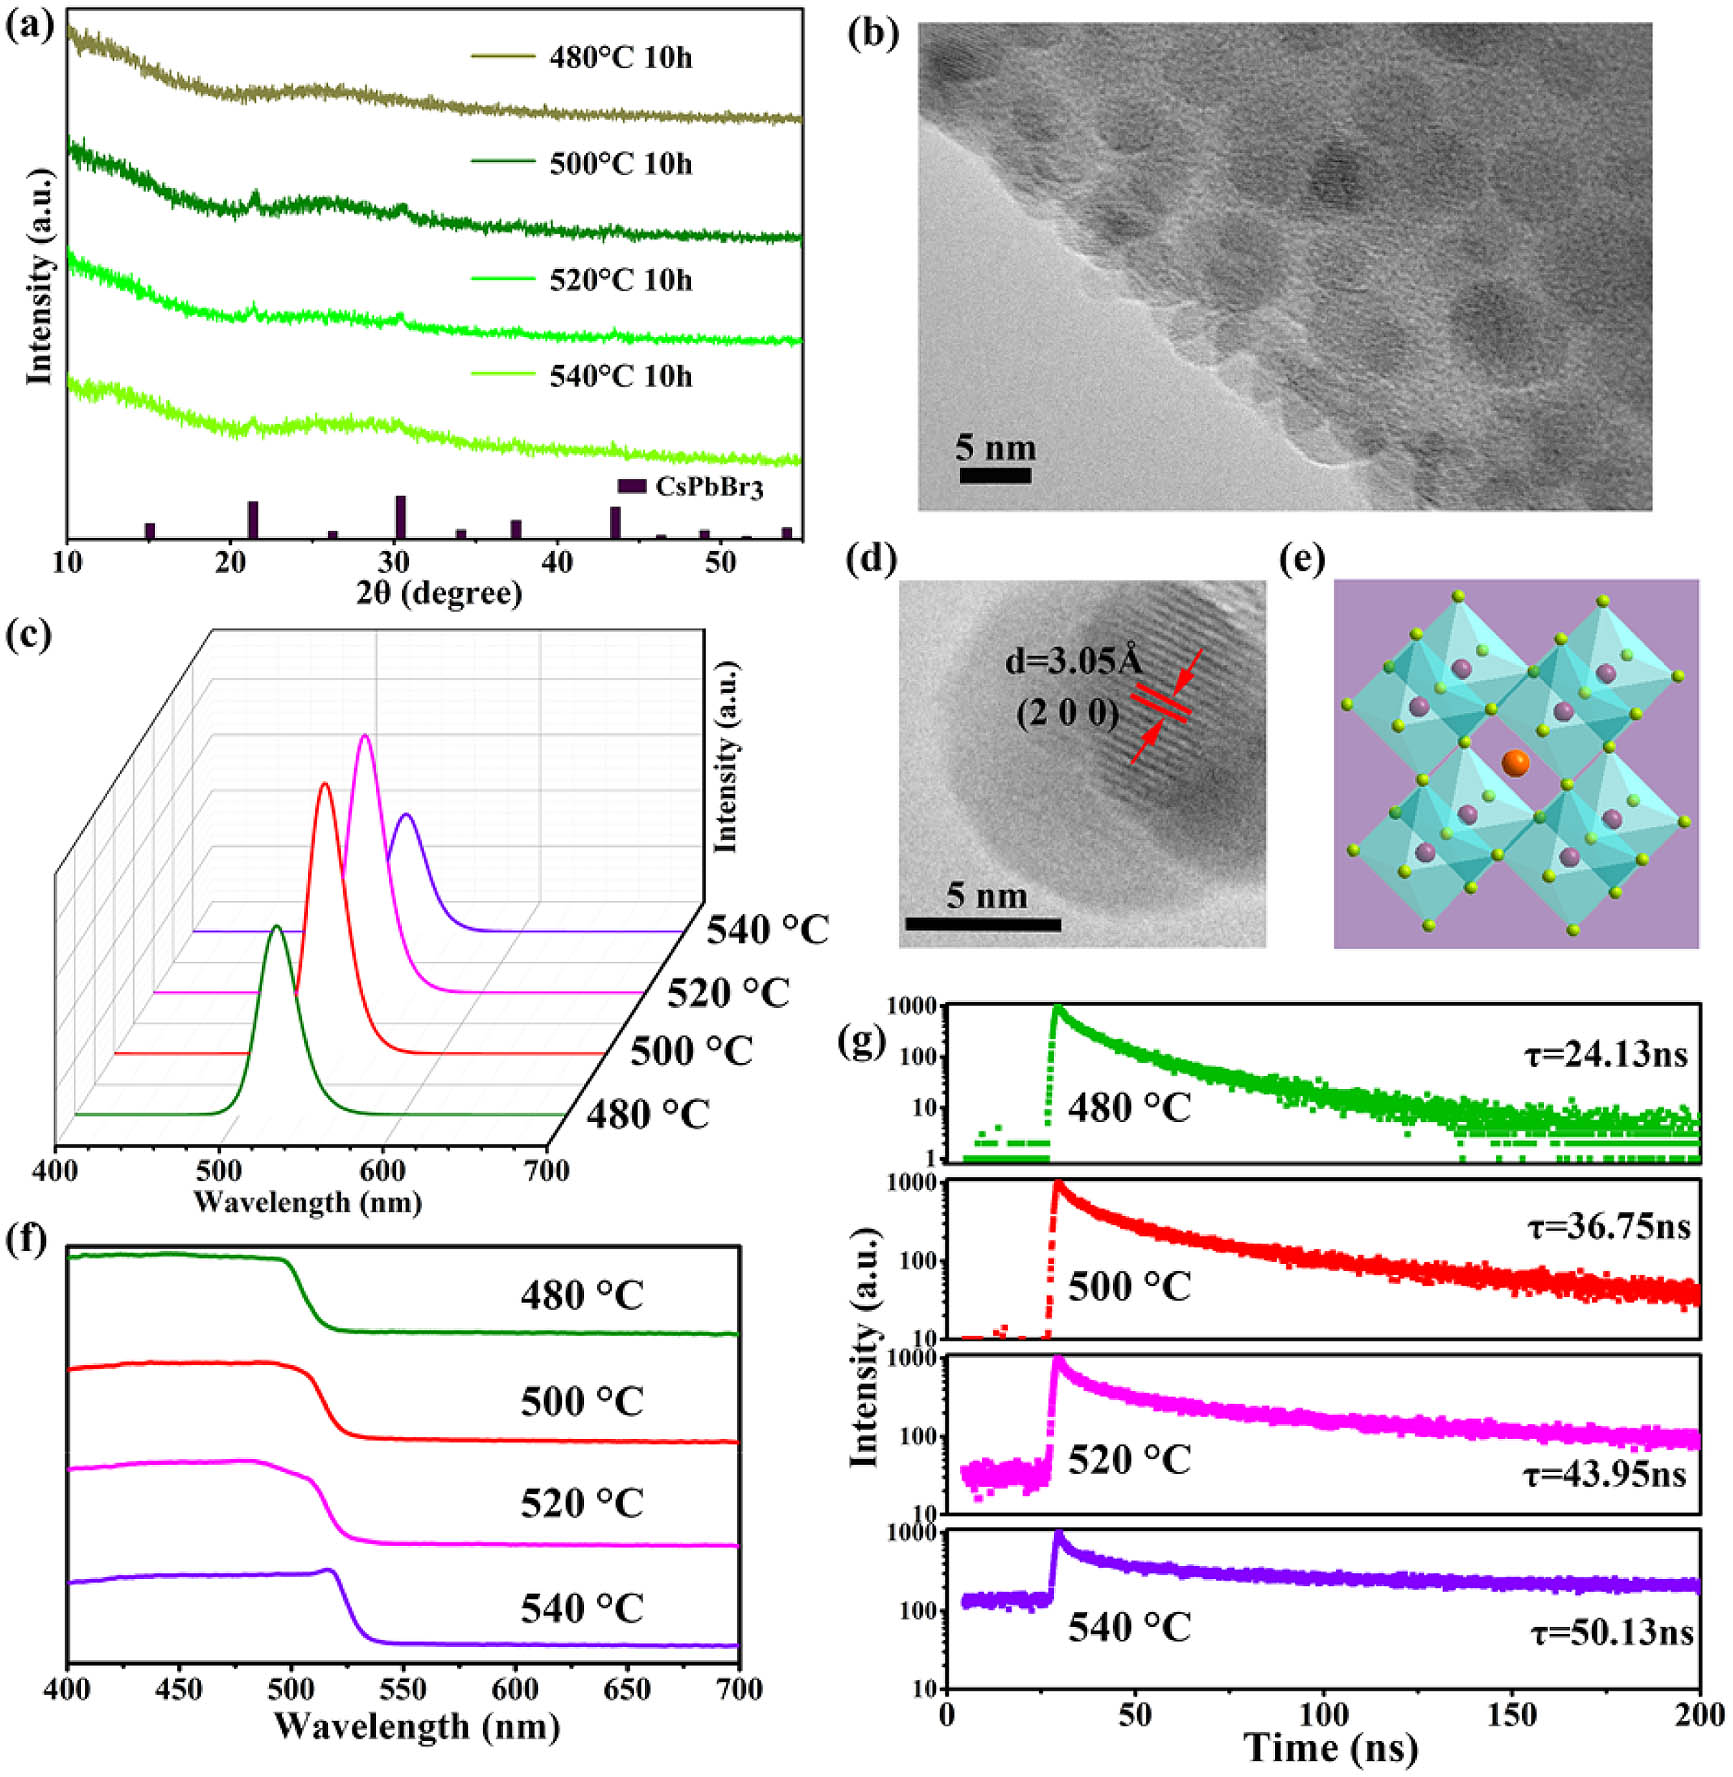
    Fig. 2. (a) XRD patterns of CPB-0Eu at different heat-treatment temperatures. (b) TEM image of CPB-0Eu at 520°C for 10 h. (c) PL spectra under UV light excitation of CPB-0Eu at different heat-treatment temperatures. (d) HRTEM image of CPB-0Eu at 520°C for 10 h. (e) Standard structure model diagram of CsPbX3 NCs. (f) Absorption spectra and (g) time-resolved PL decay profiles of CPB-0Eu at different heat-treatment temperatures.
    (a) Images of CPB-xEu glass samples under daylight (left) and in UV light (right). (b) XRD patterns of CPB-xEu glasses. (c) Bandgap spectra of CPB-0Eu at 480°C–540°C. (d) PL spectra and (e) bandgap spectra of CPB-xEu glasses.
    Fig. 3. (a) Images of CPB-xEu glass samples under daylight (left) and in UV light (right). (b) XRD patterns of CPB-xEu glasses. (c) Bandgap spectra of CPB-0Eu at 480°C–540°C. (d) PL spectra and (e) bandgap spectra of CPB-xEu glasses.
    (a) TEM image of CPB-1.8Eu (illustration is the HRTEM image of CPB-1.8Eu at 520°C for 10 h). (b) XPS survey spectra of CPB-0Eu and CPB-1.8Eu. (c) EDX mapping images of CPB-1.8Eu. Corresponding high-resolution spectra of (d) Cs 3d for CPB-0Eu and CPB-1.8Eu, (e) Pb 4f for CPB-xEu (x=0, 0.6, 1.2, 1.8), (f) Br 3d and Al 2p for CPB-0Eu and CPB-1.8Eu, and (g) Eu 3d for CPB-1.8Eu.
    Fig. 4. (a) TEM image of CPB-1.8Eu (illustration is the HRTEM image of CPB-1.8Eu at 520°C for 10 h). (b) XPS survey spectra of CPB-0Eu and CPB-1.8Eu. (c) EDX mapping images of CPB-1.8Eu. Corresponding high-resolution spectra of (d) Cs 3d for CPB-0Eu and CPB-1.8Eu, (e) Pb 4f for CPB-xEu (x=0, 0.6, 1.2, 1.8), (f) Br 3d and Al 2p for CPB-0Eu and CPB-1.8Eu, and (g) Eu 3d for CPB-1.8Eu.
    TEM images and histograms of size distribution of (a) CPB-0Eu and (b) CPB-1.8Eu. (c) Transmittance spectra of CPB-xEu (x=0, 0.6, 1.2, 1.8) glasses. (d) Characteristic PL spectra of Eu ions at 590–700 nm under 365 nm UV excitation. The inset shows an overview of PL spectra on CPB-xEu (x=0, 0.6, 1.2, 1.8) glasses. (e) Photos of CPB-xEu (x=0, 0.6, 1.2, 1.8) glasses with a thickness of ∼0.8 mm under daylight.
    Fig. 5. TEM images and histograms of size distribution of (a) CPB-0Eu and (b) CPB-1.8Eu. (c) Transmittance spectra of CPB-xEu (x=0, 0.6, 1.2, 1.8) glasses. (d) Characteristic PL spectra of Eu ions at 590–700 nm under 365 nm UV excitation. The inset shows an overview of PL spectra on CPB-xEu (x=0, 0.6, 1.2, 1.8) glasses. (e) Photos of CPB-xEu (x=0, 0.6, 1.2, 1.8) glasses with a thickness of 0.8  mm under daylight.
    RL spectra of (a) CPB-0Eu, (b) CPB-0.6Eu, and (c) CPB-1.8Eu upon increasing current of X-ray cathode tube. (d), (e) Schematic illustration of RL mechanism about CPB-xEu.
    Fig. 6. RL spectra of (a) CPB-0Eu, (b) CPB-0.6Eu, and (c) CPB-1.8Eu upon increasing current of X-ray cathode tube. (d), (e) Schematic illustration of RL mechanism about CPB-xEu.
    (a) Schematic of the experimental setup used for X-ray imaging with sample (X-rays are excited directly at the side of the sample; voltage: 50 kV, dose rate: 69.5 μGyair/s). (b) Side view and (c) front view of target materials containing a spring inside. The obtained X-ray images of (d) CPB-0Eu, (e) CPB-0.6Eu, and (f) CPB-1.8Eu by X-ray imaging.
    Fig. 7. (a) Schematic of the experimental setup used for X-ray imaging with sample (X-rays are excited directly at the side of the sample; voltage: 50 kV, dose rate: 69.5  μGyair/s). (b) Side view and (c) front view of target materials containing a spring inside. The obtained X-ray images of (d) CPB-0Eu, (e) CPB-0.6Eu, and (f) CPB-1.8Eu by X-ray imaging.
    Relative PL intensity at five different locations of the same sample.
    Fig. 8. Relative PL intensity at five different locations of the same sample.
    (a) Excitation spectra of CPB-xEu glasses. (b)–(e) PL spectra of CPB-xEu glasses excited at 365–395 nm.
    Fig. 9. (a) Excitation spectra of CPB-xEu glasses. (b)–(e) PL spectra of CPB-xEu glasses excited at 365–395 nm.
    Characteristic PL spectra of Eu ions at 560–700 nm under different wavelength excitation of CPB-0.6Eu.
    Fig. 10. Characteristic PL spectra of Eu ions at 560–700 nm under different wavelength excitation of CPB-0.6Eu.
    PL decay of CPB-0Eu and CPB-0.6Eu glasses.
    Fig. 11. PL decay of CPB-0Eu and CPB-0.6Eu glasses.
    RL spectra of CPB-xEu (x = 0, 0.6, 1.8) under X-ray excitation at a radiation dose of 105 μGyair/s and a voltage of 50 kV, including the absorption spectrum of CPB-0.6Eu to reflect the self-absorption phenomenon.
    Fig. 12. RL spectra of CPB-xEu (x = 0, 0.6, 1.8) under X-ray excitation at a radiation dose of 105 μGyair/s and a voltage of 50 kV, including the absorption spectrum of CPB-0.6Eu to reflect the self-absorption phenomenon.
    Linear relation based on RL intensity and X-ray dose rate.
    Fig. 13. Linear relation based on RL intensity and X-ray dose rate.
    The relative RL intensity of CPB-0.6Eu and CPB-0Eu glass depending on time of X-ray radiation at a radiation dose of 105 μGyair/s and a voltage of 50 kV. The illustration shows a histogram of Pb2+ solubility after 5 days of water immersion before and after X-ray radiation.
    Fig. 14. The relative RL intensity of CPB-0.6Eu and CPB-0Eu glass depending on time of X-ray radiation at a radiation dose of 105 μGyair/s and a voltage of 50 kV. The illustration shows a histogram of Pb2+ solubility after 5 days of water immersion before and after X-ray radiation.
    Yao Tong, Qin Wang, Heng Yang, Xiaoting Liu, Enrou Mei, Xiaojuan Liang, Zhijun Zhang, Weidong Xiang. Enhanced multimodal luminescence and ultrahigh stability Eu3+-doped CsPbBr3 glasses for X-ray detection and imaging[J]. Photonics Research, 2021, 9(12): 2369
    Download Citation