
Xiufeng Wang, Xiaowei Sun, Jiake Wang, Xu Gao, Hang Yang. Focus Measure Operator Combining Cosine Transform and Laplacian Operator[J]. Laser & Optoelectronics Progress, 2021, 58(24): 2410005
- Laser & Optoelectronics Progress
- Vol. 58, Issue 24, 2410005 (2021)
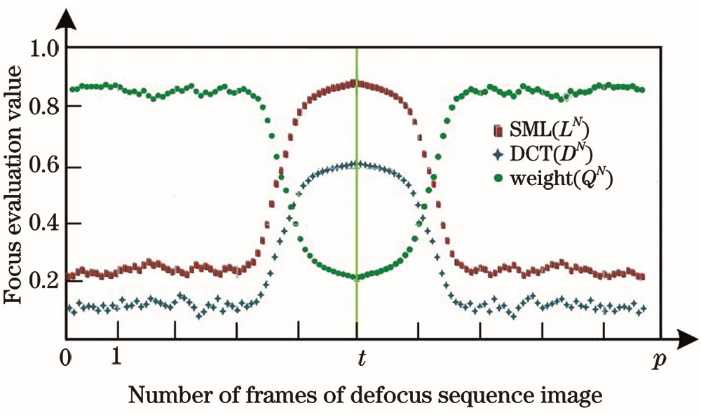
Fig. 1. Focus evaluation curve
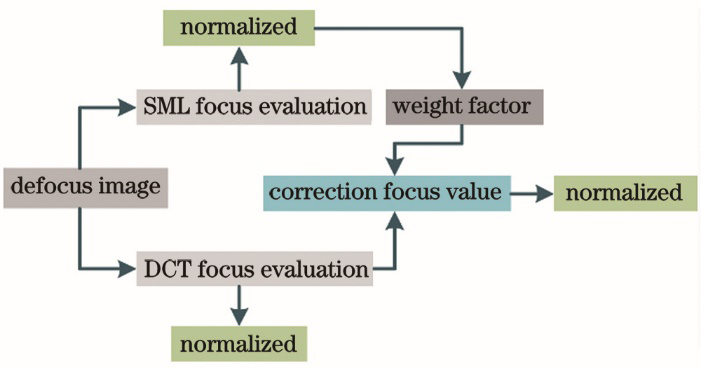
Fig. 2. Implementation block diagram of focus evaluation method
Fig. 3. Figures of object model. (a) Bar; (b) Trapezoid; (c) Circle
Fig. 4. Object scanning imaging model
Fig. 5. Simulated defocused sequence images. (a) Bar; (b) Trapezoid; (c) Circle
Fig. 6. Simulated focus evaluation curves. (a) A (136, 92); (b) B (61, 61); (c) C(126, 48)
Fig. 7. Figures of experimental device. (a) Target scanning experiment device figure with lens of f=8 mm; (b) sensor scanning experiment device figure with lens of f=8 mm; (c) sensor scanning experiment device figure with microscope lens of NA=0.65
Fig. 8. Partial defocused images. (a) Defocused image obtained by moving the target under the imaging lens; (b) defocused image obtained by moving the sensor under the imaging lens; (c) defocus image obtained by moving the sensor under the microscope lens; (d) defocused images obtained through lens zoom
Fig. 9. Focus evaluation curves of experimental defocused image. (a) A(222,333); (b) B(380,310); (c) C(290,240); (d) D (180,90)
|
Table 1. Parameter definitions and description
| |||||||||||||||||||||||||||||||||||||||||||||||||||||||||||||||||||||||
Table 2. Calculation results of simulated defocus image
| |||||||||||||||||||||||||||||||
Table 3. Device parameters used in the experiment
| |||||||||||||||||||||||||||||||||||||||||||||||||||||||||||||||||||||||
Table 4. Calculation results of experimental defocus image

Set citation alerts for the article
Please enter your email address
© Copyright 2018-2021 | Chinese Laser Press. All Rights Reserved 沪ICP备15018463号-20