
Jia Rong, Wang Feng, Liu Xiao. Design and Experiment of Time-sharing Ultraviolet Polarization Imaging Detection System[J]. Laser & Optoelectronics Progress, 2020, 57(2): 21105
- Laser & Optoelectronics Progress
- Vol. 57, Issue 2, 21105 (2020)
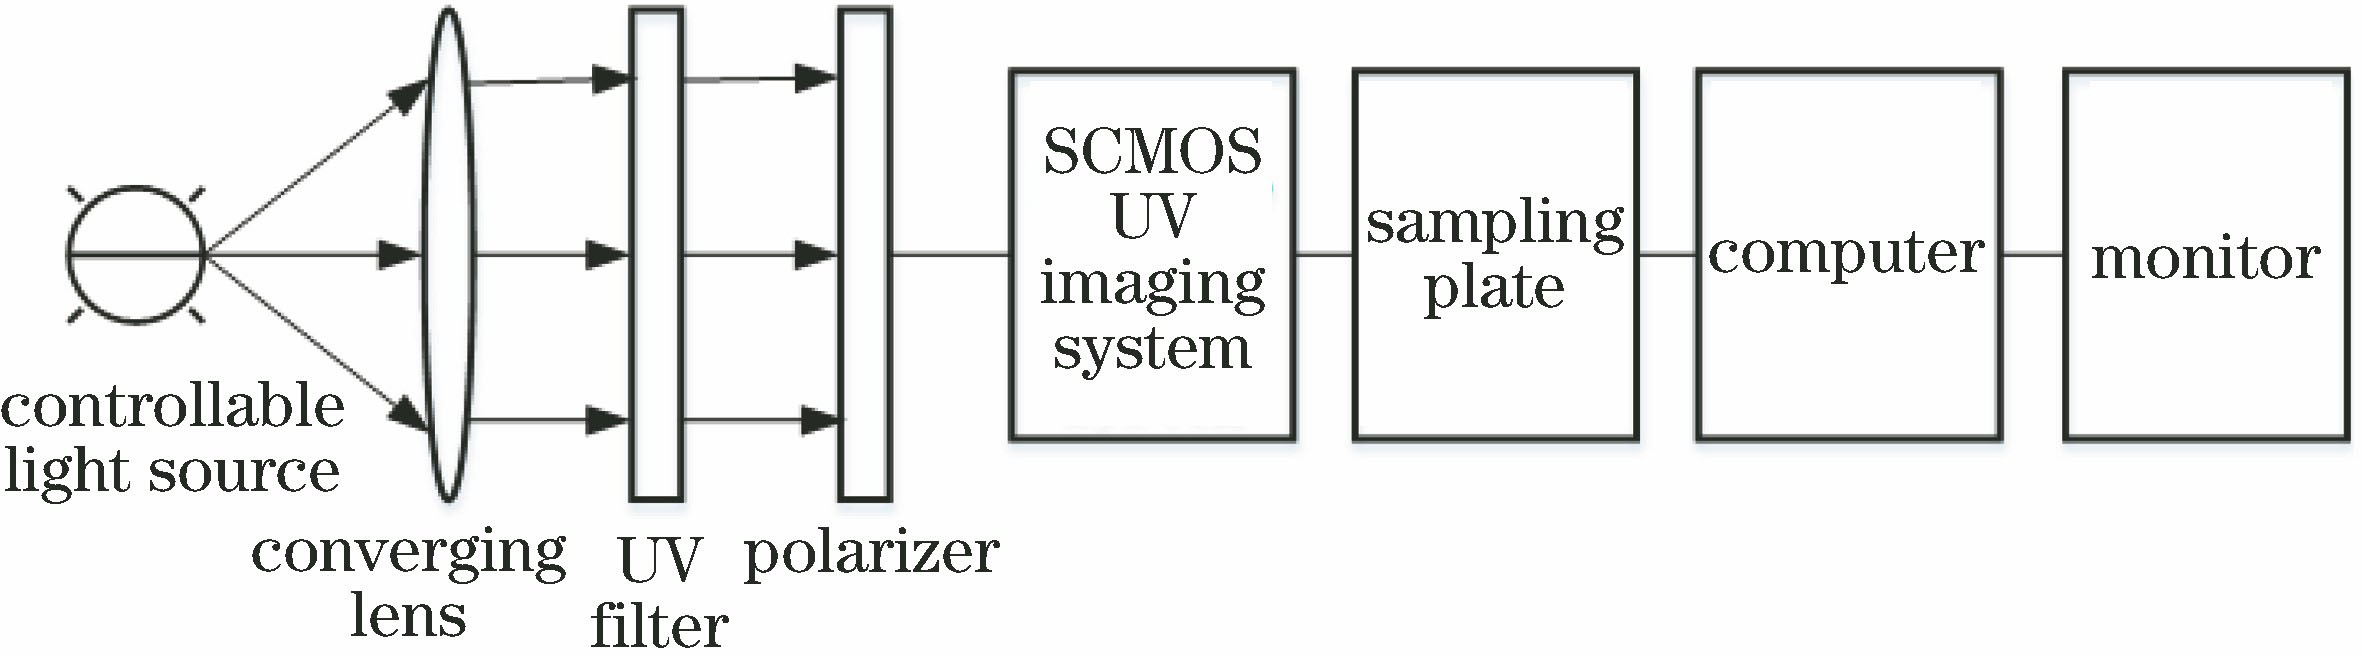
Fig. 1. Schematic of UV polarization imaging detection
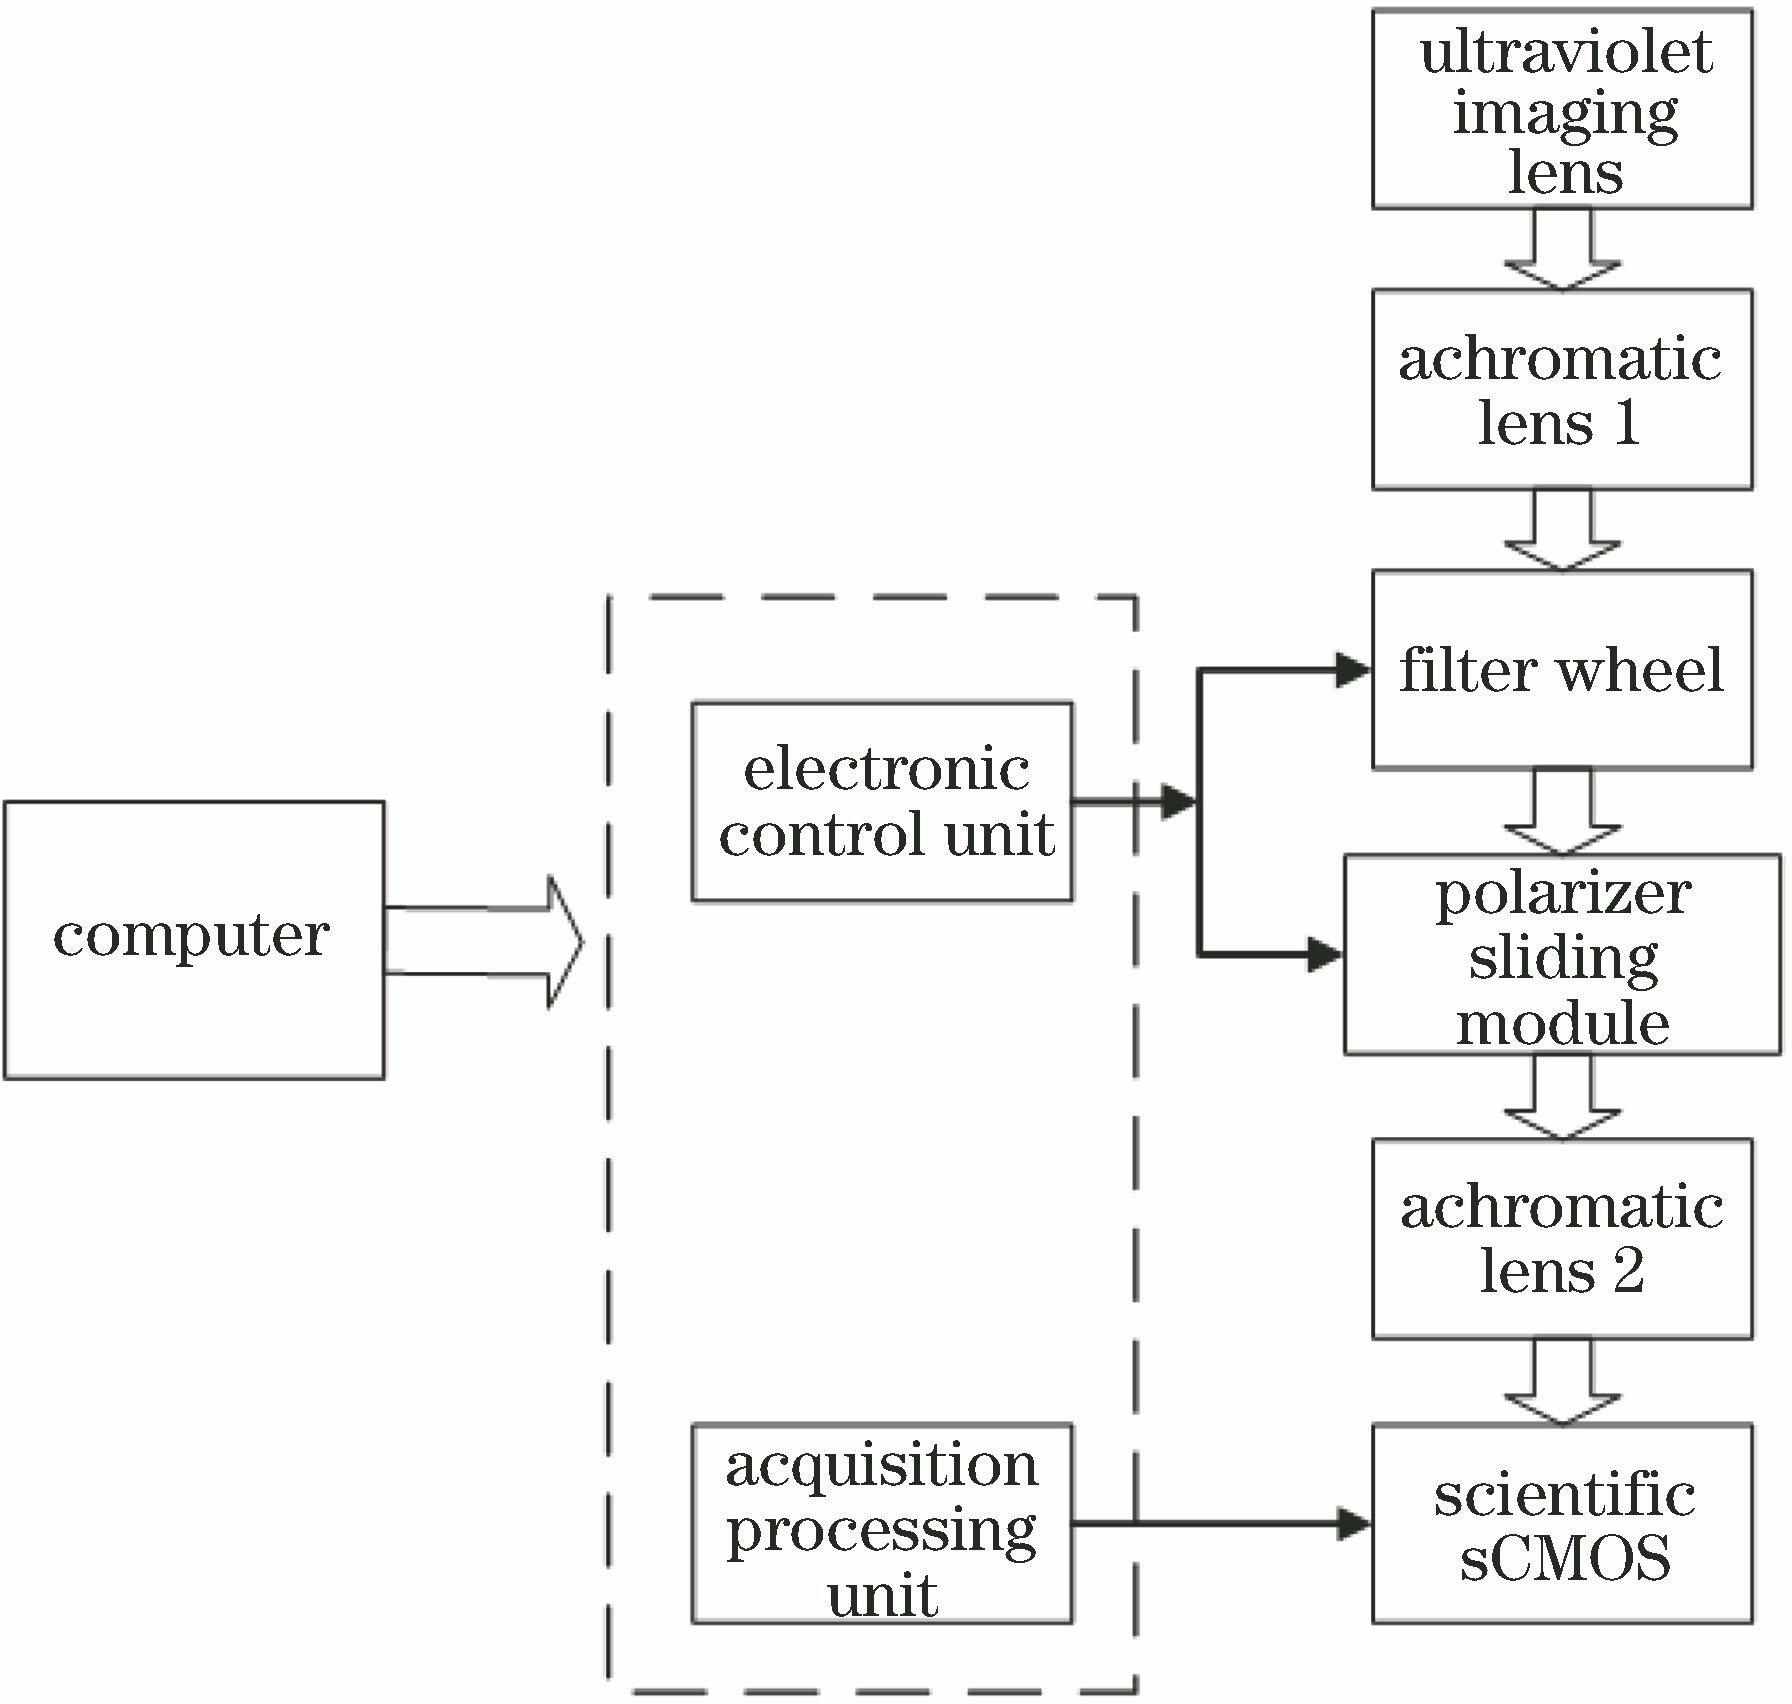
Fig. 2. Block diagram of UV polarization imaging detection system
Fig. 3. Optical system design drawing. (a) System light path diagram; (b) system MTF graph; (c) system field curvature and distortion; (d) system matrix point map
Fig. 4. System optomechanical structure
Fig. 5. Filter wheel module. (a) Wheel signal interface; (b) BNC input and output trigger
Fig. 6. Interface board circuit diagram and sliding mount
Fig. 7. General flow chart of system software
Fig. 8. UV polarization imaging detection system
Fig. 9. Non-uniformity correction image. (a) Non-uniformity correction original image; (b) non-uniformly corrected image
Fig. 10. Surface latent fingerprint UV polarization image of metal lacquered board. (a) Color digital image; (b) 0° polarization pattern; (c) 60° polarization pattern; (d) 120° polarization pattern; (e) Q figure; (f) PDI diagram
|
Table 1. Performance index of UV polarization imaging system
|
Table 2. Wheel indicator
|
Table 3. Image evaluation index result

Set citation alerts for the article
Please enter your email address
© Copyright 2018-2021 | Chinese Laser Press. All Rights Reserved 沪ICP备15018463号-20