• Journal of Semiconductors
  • Vol. 44, Issue 7, 074101 (2023)
Rongliang Li1, Yonghui Lin1, Yang Li1、2、*, Song Gao1, Wenjing Yue1, Hao Kan1, Chunwei Zhang1, and Guozhen Shen3、**
Author Affiliations
  • 1School of Information Science and Engineering, University of Jinan, Jinan 250022, China
  • 2School of Microelectronics, Shandong University, Jinan 250101, China
  • 3School of Integrated Circuits and Electronics, Beijing Institute of Technology, Beijing 100081, China
  • show less
    DOI: 10.1088/1674-4926/44/7/074101 Cite this Article
    Rongliang Li, Yonghui Lin, Yang Li, Song Gao, Wenjing Yue, Hao Kan, Chunwei Zhang, Guozhen Shen. Amorphous gallium oxide homojunction-based optoelectronic synapse for multi-functional signal processing[J]. Journal of Semiconductors, 2023, 44(7): 074101 Copy Citation Text show less
    (Color online) (a) The schematic diagram and (b) the cross-sectional SEM image of the device. The XRD spectra of (c) Ga2O3(OD) and (d) Ga2O3(OR). The XPS spectra of (e, f) Ga 2p3/2 peak, as well as (g, h) O 1s peak in two different oxygen-content films. (i) The valence band XPS spectra and (j) UPS spectra of Ga2O3(OD) and Ga2O3(OR). (k) The energy band diagrams and (l) schematic of carrier distribution of Ga2O3(OD) and Ga2O3(OR).
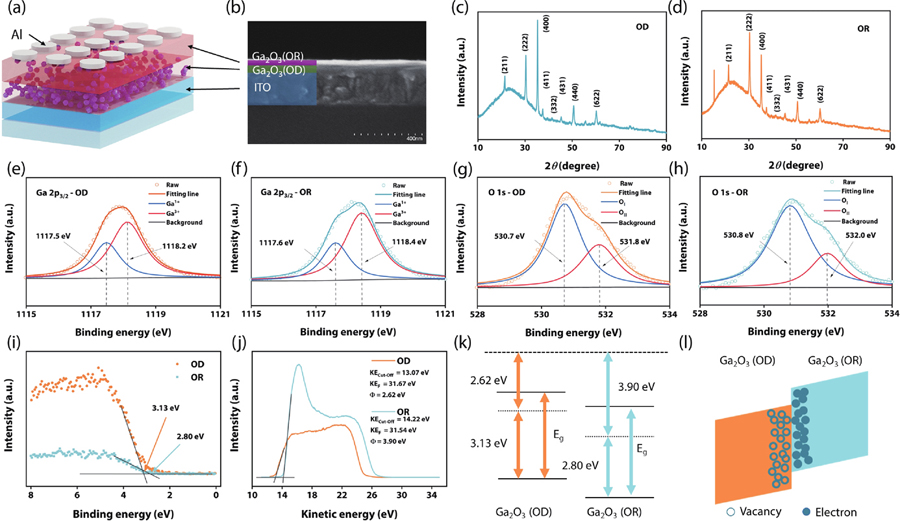
    Fig. 1. (Color online) (a) The schematic diagram and (b) the cross-sectional SEM image of the device. The XRD spectra of (c) Ga2O3(OD) and (d) Ga2O3(OR). The XPS spectra of (e, f) Ga 2p3/2 peak, as well as (g, h) O 1s peak in two different oxygen-content films. (i) The valence band XPS spectra and (j) UPS spectra of Ga2O3(OD) and Ga2O3(OR). (k) The energy band diagrams and (l) schematic of carrier distribution of Ga2O3(OD) and Ga2O3(OR).
    (Color online) (a) Schematic illustration of the neural signal transmission by biological synapses. The continuous 10 sweeping curves at (b) negative voltage (0→–1 V→0) and (c) positive voltage (0→1 V→0). The (d) EPSC and (e) IPSC at (excitation/inhibition) pulse of –1 and 1 V, respectively. The (f) PPF and (g) PPD as well as their fitting lines at negative and positive paired electrical pulses, respectively. (h) The LTP and LTD induced by 1000 negative and positive electrical pulses. (i) The LTP induced by negative electrical pulses with different duty ratios (0.4, 0.6, 0.7, 0.8, and 0.9).
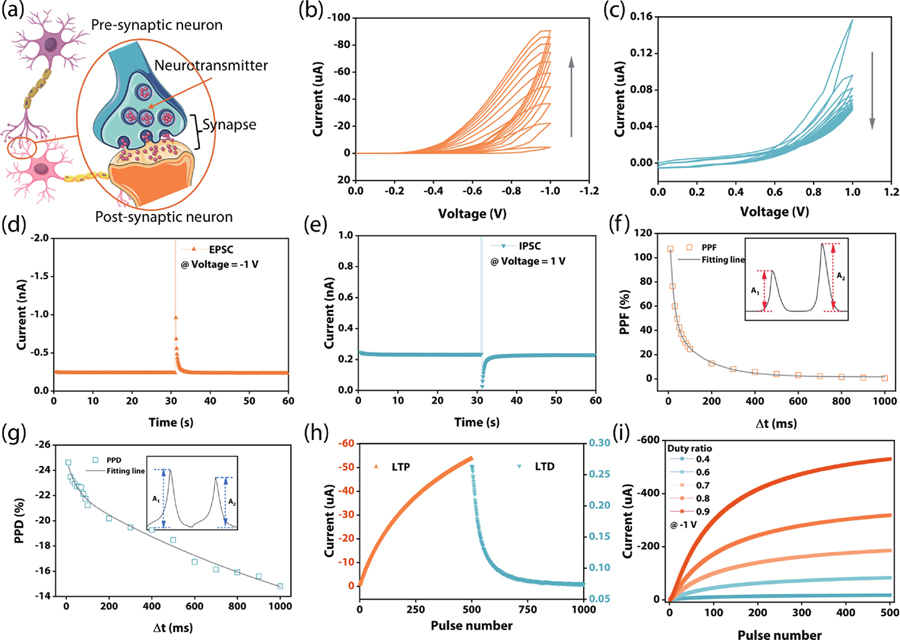
    Fig. 2. (Color online) (a) Schematic illustration of the neural signal transmission by biological synapses. The continuous 10 sweeping curves at (b) negative voltage (0→–1 V→0) and (c) positive voltage (0→1 V→0). The (d) EPSC and (e) IPSC at (excitation/inhibition) pulse of –1 and 1 V, respectively. The (f) PPF and (g) PPD as well as their fitting lines at negative and positive paired electrical pulses, respectively. (h) The LTP and LTD induced by 1000 negative and positive electrical pulses. (i) The LTP induced by negative electrical pulses with different duty ratios (0.4, 0.6, 0.7, 0.8, and 0.9).
    (Color online) (a) The schematic diagram of the device under light. The photocurrent responses of the device under different lights of (b) 365 nm and (c) 254 nm with varying intensity. (d) The photocurrent response under consecutive optical pulses (3.068 mW/cm2: 1 s, dark: 1 s). The photocurrent responses of the device under 254 nm light with different (e) durations (1, 2, 5, 10, and 15 s) and (f) pulse numbers (5, 10, 20, and 40). (g) The PPF induced by paired optical pulses. (h) The variation of the PPF index with the intervals of paired optical pulses. (i) The “Learning-Forgetting-Relearning” process induced by three periodic lights (3.068 mW/cm2: 10 s and dark: 15 s).
    Fig. 3. (Color online) (a) The schematic diagram of the device under light. The photocurrent responses of the device under different lights of (b) 365 nm and (c) 254 nm with varying intensity. (d) The photocurrent response under consecutive optical pulses (3.068 mW/cm2: 1 s, dark: 1 s). The photocurrent responses of the device under 254 nm light with different (e) durations (1, 2, 5, 10, and 15 s) and (f) pulse numbers (5, 10, 20, and 40). (g) The PPF induced by paired optical pulses. (h) The variation of the PPF index with the intervals of paired optical pulses. (i) The “Learning-Forgetting-Relearning” process induced by three periodic lights (3.068 mW/cm2: 10 s and dark: 15 s).
    (Color online) The high-pass filter and visual system. (a) The diagram of MFOS’s filtering effect. (b) The photocurrent responses triggered by 20 optical pulses with declining pulse frequencies (0.5, 0.33, 0.25, 0.20, 0.17, and 0.14 Hz). (c) Dependence of the EPSC (A20/A1) on the pulse frequency. The threshold frequency (fT) is 0.33 Hz. (d) The filtering process of the image moon. (Ⅰ) The original image. (Ⅱ) The high-pass filtered image. (e) The filtering process of the moon image with Gaussian noise. (Ⅰ) The original image with Gaussian noise. (Ⅱ) The high-pass filtered image. (f) The perception and memory characteristics of the MFOS-based visual system under illumination with varying (Ⅰ) intensity and (Ⅱ) frequency.
    Fig. 4. (Color online) The high-pass filter and visual system. (a) The diagram of MFOS’s filtering effect. (b) The photocurrent responses triggered by 20 optical pulses with declining pulse frequencies (0.5, 0.33, 0.25, 0.20, 0.17, and 0.14 Hz). (c) Dependence of the EPSC (A20/A1) on the pulse frequency. The threshold frequency (fT) is 0.33 Hz. (d) The filtering process of the image moon. (Ⅰ) The original image. (Ⅱ) The high-pass filtered image. (e) The filtering process of the moon image with Gaussian noise. (Ⅰ) The original image with Gaussian noise. (Ⅱ) The high-pass filtered image. (f) The perception and memory characteristics of the MFOS-based visual system under illumination with varying (Ⅰ) intensity and (Ⅱ) frequency.
    (Color online) The implementation of Pavlovian associative learning. (a) The four conversion processes of the puppy when (Ⅰ) only the bell rings, (Ⅱ) only feeding, (Ⅲ) bell ringing and feeding occur in parallel, and (Ⅳ) bell rings again. (b) The four kinds of optical signal arrangements and combinations (wavelength: 365 and 254 nm, intensity: 976 μW/cm2). (Ⅰ) only 365 nm, (Ⅱ) only 254 nm, (Ⅲ) 365 nm and 254 nm in parallel, and (Ⅳ) only 365 nm again. (c) The state conversion of the device from (Ⅰ) failed firing to (Ⅱ–Ⅳ) firing (threshold current is 0.6 nA).
    Fig. 5. (Color online) The implementation of Pavlovian associative learning. (a) The four conversion processes of the puppy when (Ⅰ) only the bell rings, (Ⅱ) only feeding, (Ⅲ) bell ringing and feeding occur in parallel, and (Ⅳ) bell rings again. (b) The four kinds of optical signal arrangements and combinations (wavelength: 365 and 254 nm, intensity: 976 μW/cm2). (Ⅰ) only 365 nm, (Ⅱ) only 254 nm, (Ⅲ) 365 nm and 254 nm in parallel, and (Ⅳ) only 365 nm again. (c) The state conversion of the device from (Ⅰ) failed firing to (Ⅱ–Ⅳ) firing (threshold current is 0.6 nA).
    (Color online) (a) The diagram of the IMP logic gate. Different responses for the optical signals of (b) 254 nm and (c) 365 nm with varying intensity at a Vread of 0.03 V. The (d) measured data, (e) logic data, and (f) truth table of the logic gate of IMP (threshold current is 0.14 nA).
    Fig. 6. (Color online) (a) The diagram of the IMP logic gate. Different responses for the optical signals of (b) 254 nm and (c) 365 nm with varying intensity at a Vread of 0.03 V. The (d) measured data, (e) logic data, and (f) truth table of the logic gate of IMP (threshold current is 0.14 nA).
    Rongliang Li, Yonghui Lin, Yang Li, Song Gao, Wenjing Yue, Hao Kan, Chunwei Zhang, Guozhen Shen. Amorphous gallium oxide homojunction-based optoelectronic synapse for multi-functional signal processing[J]. Journal of Semiconductors, 2023, 44(7): 074101
    Download Citation