• Laser & Optoelectronics Progress
  • Vol. 56, Issue 8, 081006 (2019)
Zuwu Wang1、2、*, Jun Han1、2, Xiaobin Sun3, and Bo Yang3
Author Affiliations
  • 1 School of Communication and Information Engineering, Shanghai University, Shanghai 200444, China
  • 2 Shanghai Institute of Advanced Communications and Data Science, Shanghai 200444, China
  • 3 State Grid Shandong Electric Power Company, Jinan, Shandong 250000, China
  • show less
    DOI: 10.3788/LOP56.081006 Cite this Article Set citation alerts
    Zuwu Wang, Jun Han, Xiaobin Sun, Bo Yang. Methodfor Orientation Determination of Transmission Line Tower Based on Visual Navigation[J]. Laser & Optoelectronics Progress, 2019, 56(8): 081006 Copy Citation Text show less
    Aerial images and diagrams of towers. (a) Front image; (b) front side image; (c) side image; (d) front view diagram; (e) front side view diagram; (f) side view diagram
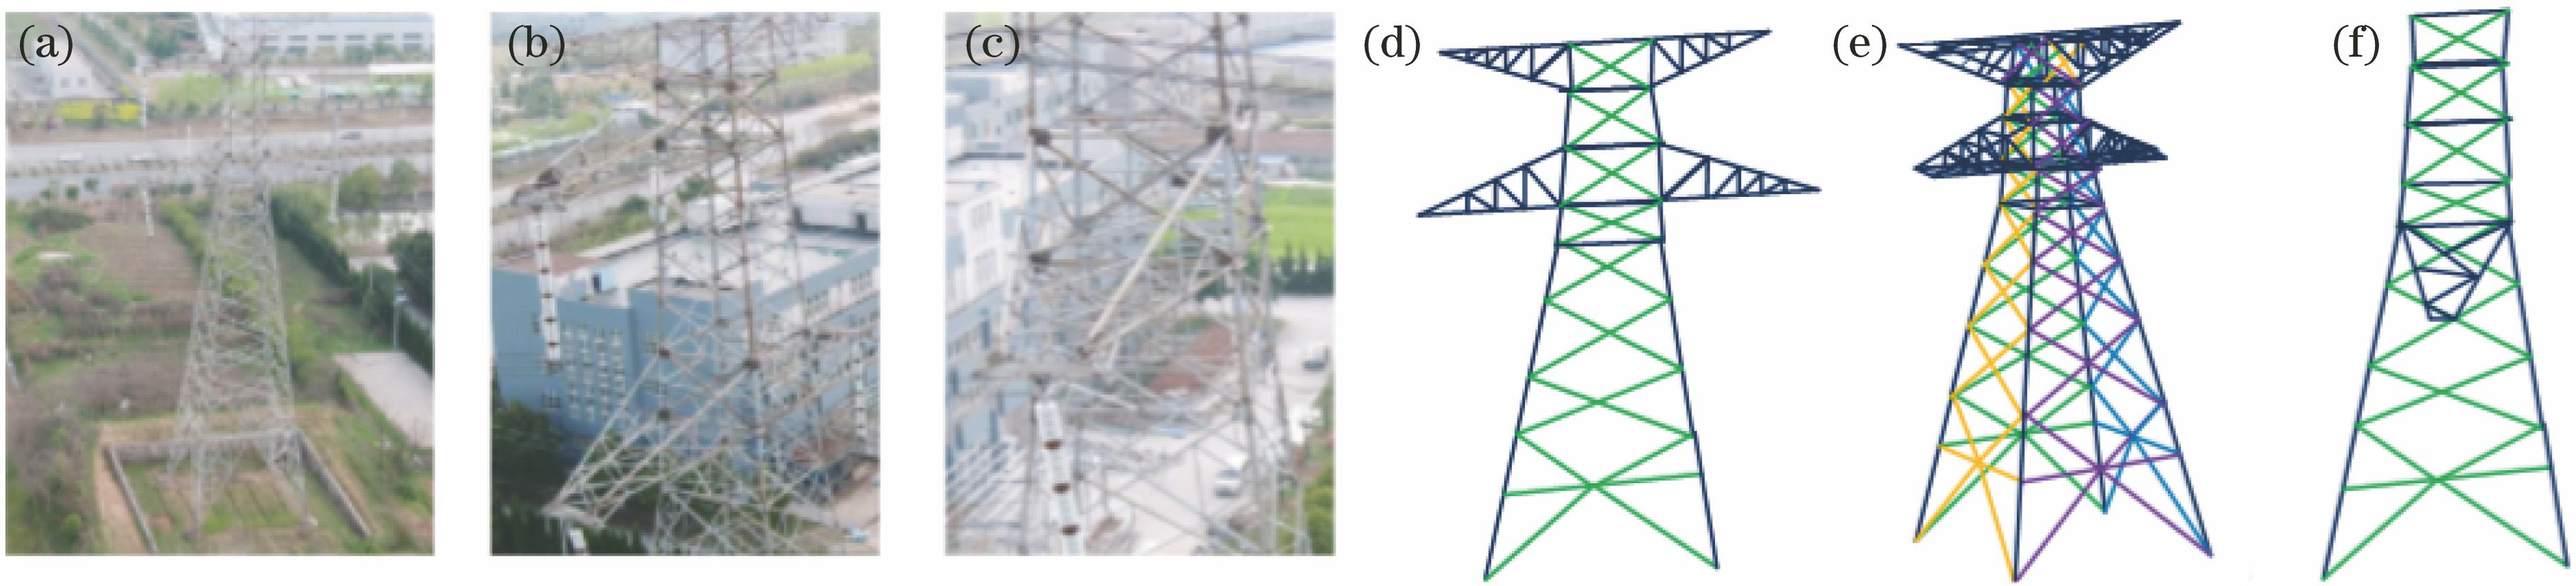
    Fig. 1. Aerial images and diagrams of towers. (a) Front image; (b) front side image; (c) side image; (d) front view diagram; (e) front side view diagram; (f) side view diagram
    Broken lines formed when wire passing through straight tower
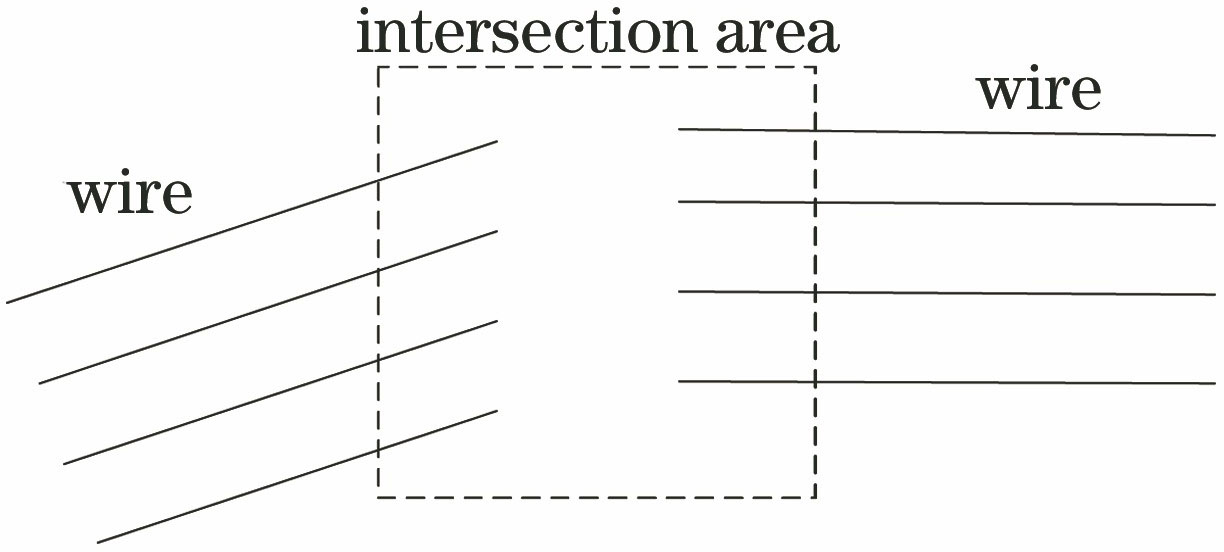
    Fig. 2. Broken lines formed when wire passing through straight tower
    Location relationship between guiding lines and wires in tensile tower
    Fig. 3. Location relationship between guiding lines and wires in tensile tower
    Structural characteristics of tower. (a) Cross slanted segments of tower head; (b)(c) slanted segments converged onto main frame of tower body; (d)(e) crossing characteristics in tower
    Fig. 4. Structural characteristics of tower. (a) Cross slanted segments of tower head; (b)(c) slanted segments converged onto main frame of tower body; (d)(e) crossing characteristics in tower
    Framework of tower detection from far to near
    Fig. 5. Framework of tower detection from far to near
    Calculation of gradient for each pixel point
    Fig. 6. Calculation of gradient for each pixel point
    Angular distribution of gradient
    Fig. 7. Angular distribution of gradient
    Gradient statistical histogram in each cell
    Fig. 8. Gradient statistical histogram in each cell
    HOG feature extraction and MLP perception model classification
    Fig. 9. HOG feature extraction and MLP perception model classification
    Visual perception platform for UAV and local areas of tower under different orientations. (a) Visual perception platform for UAV; (b1) front of tower top; (b2) front side of tower top; (b3) side of tower top; (c1) front of tower body; (c2) front side of tower body; (c3) side of tower body; (d1) front of tower bottom; (d2) front side of tower bottom; (d3) side of tower bottom
    Fig. 10. Visual perception platform for UAV and local areas of tower under different orientations. (a) Visual perception platform for UAV; (b1) front of tower top; (b2) front side of tower top; (b3) side of tower top; (c1) front of tower body; (c2) front side of tower body; (c3) side of tower body; (d1) front of tower bottom; (d2) front side of tower bottom; (d3) side of tower bottom
    AlgorithmFig. 10 (b)Fig. 10 (c)Fig. 10 (d)
    FrontFront sideSideFrontFront sideSideFrontFront sideSide
    ZF-Net+Faster RCNN0.6820.6910.7020.6180.6990.6640.6770.6860.629
    VGG16+Faster RCNN0.7400.7240.7430.6410.7560.7510.7650.7310.763
    ResNet-101+Faster RCNN0.7720.7800.7880.6930.8010.7930.7870.7590.789
    HOG+MLP(Proposed)0.8260.8180.8590.8790.8910.9020.8780.8690.821
    Table 1. Accuracy rate of identification of local area orientation of tower
    AlgorithmFig. 10 (b)Fig. 10 (c)Fig. 10 (d)
    FrontFront sideSideFrontFront sideSideFrontFront sideSide
    ZF-Net +Faster RCNN313329263037293331
    VGG16+Faster RCNN140159154145148143141153157
    ResNet-101+Faster RCNN172175168169172174176167168
    HOG+MLP(Proposed)810911910898
    Table 2. Time required for identification of local area orientation of towerms
    AlgorithmFig. 10 (b)Fig. 10 (c)Fig. 10 (d)
    FrontFront sideSideFrontFront sideSideFrontFront sideSide
    ZF-Net+Faster RCNN0.6530.6710.7080.6210.6520.6340.6500.6190.639
    VGG16+Faster RCNN0.7320.7380.7490.6610.7540.7520.7620.7250.778
    ResNet-101+Faster RCNN0.7810.7830.7980.7010.8010.8080.7870.7620.789
    HOG+MLP(Proposed)0.8330.8280.8550.8760.8950.8930.8740.8660.834
    Table 3. Accuracy rate of local area orientation of tower after data augmentation
    AlgorithmFig. 10 (b)Fig. 10 (c)Fig. 10 (d)
    FrontFront sideSideFrontFront sideSideFrontFront sideSide
    ZF-Net+Faster RCNN313029273233303427
    VGG16+Faster RCNN139148140139148141143142149
    ResNet-101+Faster RCNN168171163165177168179165161
    HOG+MLP(Proposed)10768911998
    Table 4. Time required for local area orientation of tower after data augmentationms
    Zuwu Wang, Jun Han, Xiaobin Sun, Bo Yang. Methodfor Orientation Determination of Transmission Line Tower Based on Visual Navigation[J]. Laser & Optoelectronics Progress, 2019, 56(8): 081006
    Download Citation