• Photonics Research
  • Vol. 12, Issue 2, 301 (2024)
Felipe Guzmán1, Jorge Tapia1, Camilo Weinberger1, Nicolás Hernández1, Jorge Bacca2, Benoit Neichel3, and Esteban Vera1、*
Author Affiliations
  • 1School of Electrical Engineering, Pontificia Universidad Católica de Valparaíso, Valparaíso, Chile
  • 2Department of Systems Engineering, Universidad Industrial de Santander, Bucaramanga, Colombia
  • 3Laboratoire d’Astrophysique de Marseille, Marseille, France
  • show less
    DOI: 10.1364/PRJ.502245 Cite this Article Set citation alerts
    Felipe Guzmán, Jorge Tapia, Camilo Weinberger, Nicolás Hernández, Jorge Bacca, Benoit Neichel, Esteban Vera. Deep optics preconditioner for modulation-free pyramid wavefront sensing[J]. Photonics Research, 2024, 12(2): 301 Copy Citation Text show less
    Simplified optical scheme for pyramid Fourier-based wavefront sensing.
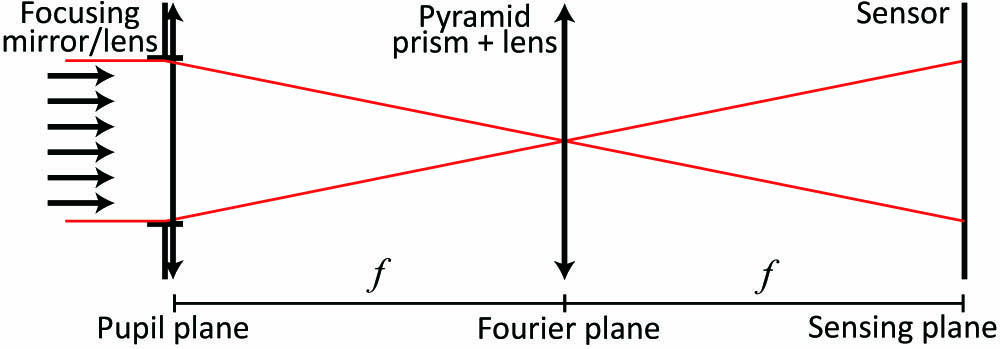
    Fig. 1. Simplified optical scheme for pyramid Fourier-based wavefront sensing.
    (a)–(c) Pyramids simulated with different values of θ; (d)–(f) respective intensity distributions of a propagated plane wave passing through pyramids (a)–(c) into the sensing plane. With a larger θ, the subpupils of the pyramid are farther apart from each other for the same D/2f ratio.
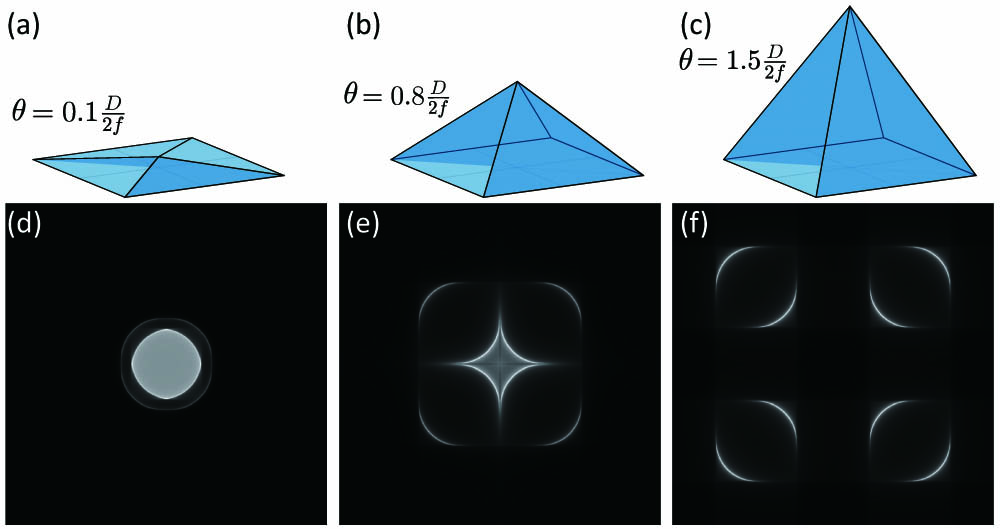
    Fig. 2. (a)–(c) Pyramids simulated with different values of θ; (d)–(f) respective intensity distributions of a propagated plane wave passing through pyramids (a)–(c) into the sensing plane. With a larger θ, the subpupils of the pyramid are farther apart from each other for the same D/2f ratio.
    DPWFS E2E sensing and reconstruction scheme. An arbitrary phase map of a turbulence profile enters the simulated optical system with the optical layer DE in the forward pass of the DPWFS. Then, a linear estimation of the phase is performed with the pseudo-inverse of the system matrix. The loss function is computed with the error between the Zernike coefficient estimation and the Zernike decomposition of the known phase map. Finally, the error is backpropagated to update each pixel of the DE.
    Fig. 3. DPWFS E2E sensing and reconstruction scheme. An arbitrary phase map of a turbulence profile enters the simulated optical system with the optical layer DE in the forward pass of the DPWFS. Then, a linear estimation of the phase is performed with the pseudo-inverse of the system matrix. The loss function is computed with the error between the Zernike coefficient estimation and the Zernike decomposition of the known phase map. Finally, the error is backpropagated to update each pixel of the DE.
    Estimation performance results using noiseless measurements for a variety of turbulence strengths. The PWFS at different modulation levels is compared with the DPWFS-R1 trained without noise. Each data point is the mean of 10,000 realizations.
    Fig. 4. Estimation performance results using noiseless measurements for a variety of turbulence strengths. The PWFS at different modulation levels is compared with the DPWFS-R1 trained without noise. Each data point is the mean of 10,000 realizations.
    Comparison results for the sensitivity s, linearity d, and SD factor sd for the PWFS at different modulation levels and the DPWFS-R1.
    Fig. 5. Comparison results for the sensitivity s, linearity d, and SD factor sd for the PWFS at different modulation levels and the DPWFS-R1.
    Simulation of a closed-loop AO system with a turbulence strength of D/r0=35. We compare the evolution of the wavefront error for the unmodulated PWFS-M0, PWFS-M1 with 1λ/D, PWFS-M2 with 2λ/D, and the DPWFS-R1, after closing the loop at frame 45 with a closed-loop gain of k=0.3. Inset, comparison of the reconstructed PSF and Strehl ratio achieved at the last frame.
    Fig. 6. Simulation of a closed-loop AO system with a turbulence strength of D/r0=35. We compare the evolution of the wavefront error for the unmodulated PWFS-M0, PWFS-M1 with 1λ/D, PWFS-M2 with 2λ/D, and the DPWFS-R1, after closing the loop at frame 45 with a closed-loop gain of k=0.3. Inset, comparison of the reconstructed PSF and Strehl ratio achieved at the last frame.
    Estimation performance results using noisy measurements for a variety of turbulence strengths. We added readout noise with σ=1 and photon noise with Bp=0.1. The unmodulated PWFS and modulated PWFS at 3λ/D are compared with the DPWFS-R1 and DPWFS-R2 trained without noise for different turbulence ranges, and the DPWFS-N1 trained with noisy measurements in the same range as DPWFS-R1.
    Fig. 7. Estimation performance results using noisy measurements for a variety of turbulence strengths. We added readout noise with σ=1 and photon noise with Bp=0.1. The unmodulated PWFS and modulated PWFS at 3λ/D are compared with the DPWFS-R1 and DPWFS-R2 trained without noise for different turbulence ranges, and the DPWFS-N1 trained with noisy measurements in the same range as DPWFS-R1.
    Comparison results for the sensitivity s, linearity d, and SD factor sd for the unmodulated PWFS and modulated PWFS at 3λ/D are compared with the DPWFS-R1 and DPWFS-R2 trained without noise for different turbulence ranges, and the DPWFS-N1 trained with noisy measurements in the same range as DPWFS-R1.
    Fig. 8. Comparison results for the sensitivity s, linearity d, and SD factor sd for the unmodulated PWFS and modulated PWFS at 3λ/D are compared with the DPWFS-R1 and DPWFS-R2 trained without noise for different turbulence ranges, and the DPWFS-N1 trained with noisy measurements in the same range as DPWFS-R1.
    Performance results for different combinations of photon and readout noise statistics. Each colored surface represents the RMSE fluctuations for the unmodulated PWFS, DPWFS-R1, and DPWFS-N1. Every plot represents a fixed turbulence regime. (a) D/r0=5; (b) D/r0=10; (c) D/r0=15; (d) D/r0=20. Each data point of the 20×20 grids corresponds to the average of 4000 realizations.
    Fig. 9. Performance results for different combinations of photon and readout noise statistics. Each colored surface represents the RMSE fluctuations for the unmodulated PWFS, DPWFS-R1, and DPWFS-N1. Every plot represents a fixed turbulence regime. (a) D/r0=5; (b) D/r0=10; (c) D/r0=15; (d) D/r0=20. Each data point of the 20×20 grids corresponds to the average of 4000 realizations.
    DE training results after 120 epochs. (a) Phase distribution of the DPWFS-R1 DE trained without noise; (b) phase distribution of the DPWFS-R2 DE trained without noise; (c) phase distribution of the DPWFS-N1 DE trained with readout noise of σ=1. For the evolution of the training, please refer to Visualization 1.
    Fig. 10. DE training results after 120 epochs. (a) Phase distribution of the DPWFS-R1 DE trained without noise; (b) phase distribution of the DPWFS-R2 DE trained without noise; (c) phase distribution of the DPWFS-N1 DE trained with readout noise of σ=1. For the evolution of the training, please refer to Visualization 1.
    Training results for different levels of turbulence. The continuous lines represent the testing of each turbulence profile without noise, and the segmented line is with the same phase but now with Bp=0.1 photon noise applied to the measurement. The colors are our different strategies, where red is the nonmodulated PWFS, blue is our DPWFS-R1, and black is the PUPIL-R1. Each data point represents the mean of 10,000 realizations.
    Fig. 11. Training results for different levels of turbulence. The continuous lines represent the testing of each turbulence profile without noise, and the segmented line is with the same phase but now with Bp=0.1 photon noise applied to the measurement. The colors are our different strategies, where red is the nonmodulated PWFS, blue is our DPWFS-R1, and black is the PUPIL-R1. Each data point represents the mean of 10,000 realizations.
    Optical setup to implement the digital PWFS or the designed DPWFS at the PULPOS AO bench.
    Fig. 12. Optical setup to implement the digital PWFS or the designed DPWFS at the PULPOS AO bench.
    Experimental performance results comparing the unmodulated pyramid PWFS-M0, the modulated pyramid at 2λ/D PWFS-M2, and the DPWFS-N1. Plots are shown with a band of 1σ of the RMSE for different turbulence levels; (inset) zoomed version at weak turbulences.
    Fig. 13. Experimental performance results comparing the unmodulated pyramid PWFS-M0, the modulated pyramid at 2λ/D PWFS-M2, and the DPWFS-N1. Plots are shown with a band of 1σ of the RMSE for different turbulence levels; (inset) zoomed version at weak turbulences.
    Felipe Guzmán, Jorge Tapia, Camilo Weinberger, Nicolás Hernández, Jorge Bacca, Benoit Neichel, Esteban Vera. Deep optics preconditioner for modulation-free pyramid wavefront sensing[J]. Photonics Research, 2024, 12(2): 301
    Download Citation