• Chinese Optics Letters
  • Vol. 16, Issue 3, 033001 (2018)
Pengyuan Chang, Bo Pang, Yisheng Wu, and Jingbiao Chen*
Author Affiliations
  • State Key Laboratory of Advanced Optical Communication System and Network, School of Electronics Engineering and Computer Science, Peking University, Beijing 100871, China
  • show less
    DOI: 10.3788/COL201816.033001 Cite this Article Set citation alerts
    Pengyuan Chang, Bo Pang, Yisheng Wu, Jingbiao Chen. Excited-state population distributions of alkaline-earth metal in a hollow cathode lamp[J]. Chinese Optics Letters, 2018, 16(3): 033001 Copy Citation Text show less
    Experimental schemes of Ca HCL and Sr HCL in the configuration of element-balance-detection technology for spectrum research.
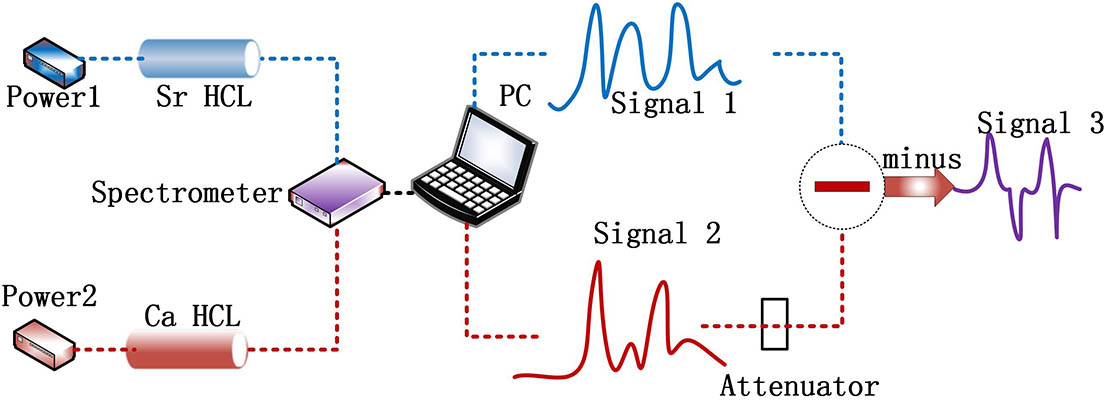
    Fig. 1. Experimental schemes of Ca HCL and Sr HCL in the configuration of element-balance-detection technology for spectrum research.
    (a) Energy diagram of Sr atoms’ transitions. (b) Energy diagram of Ca atoms’ transitions.
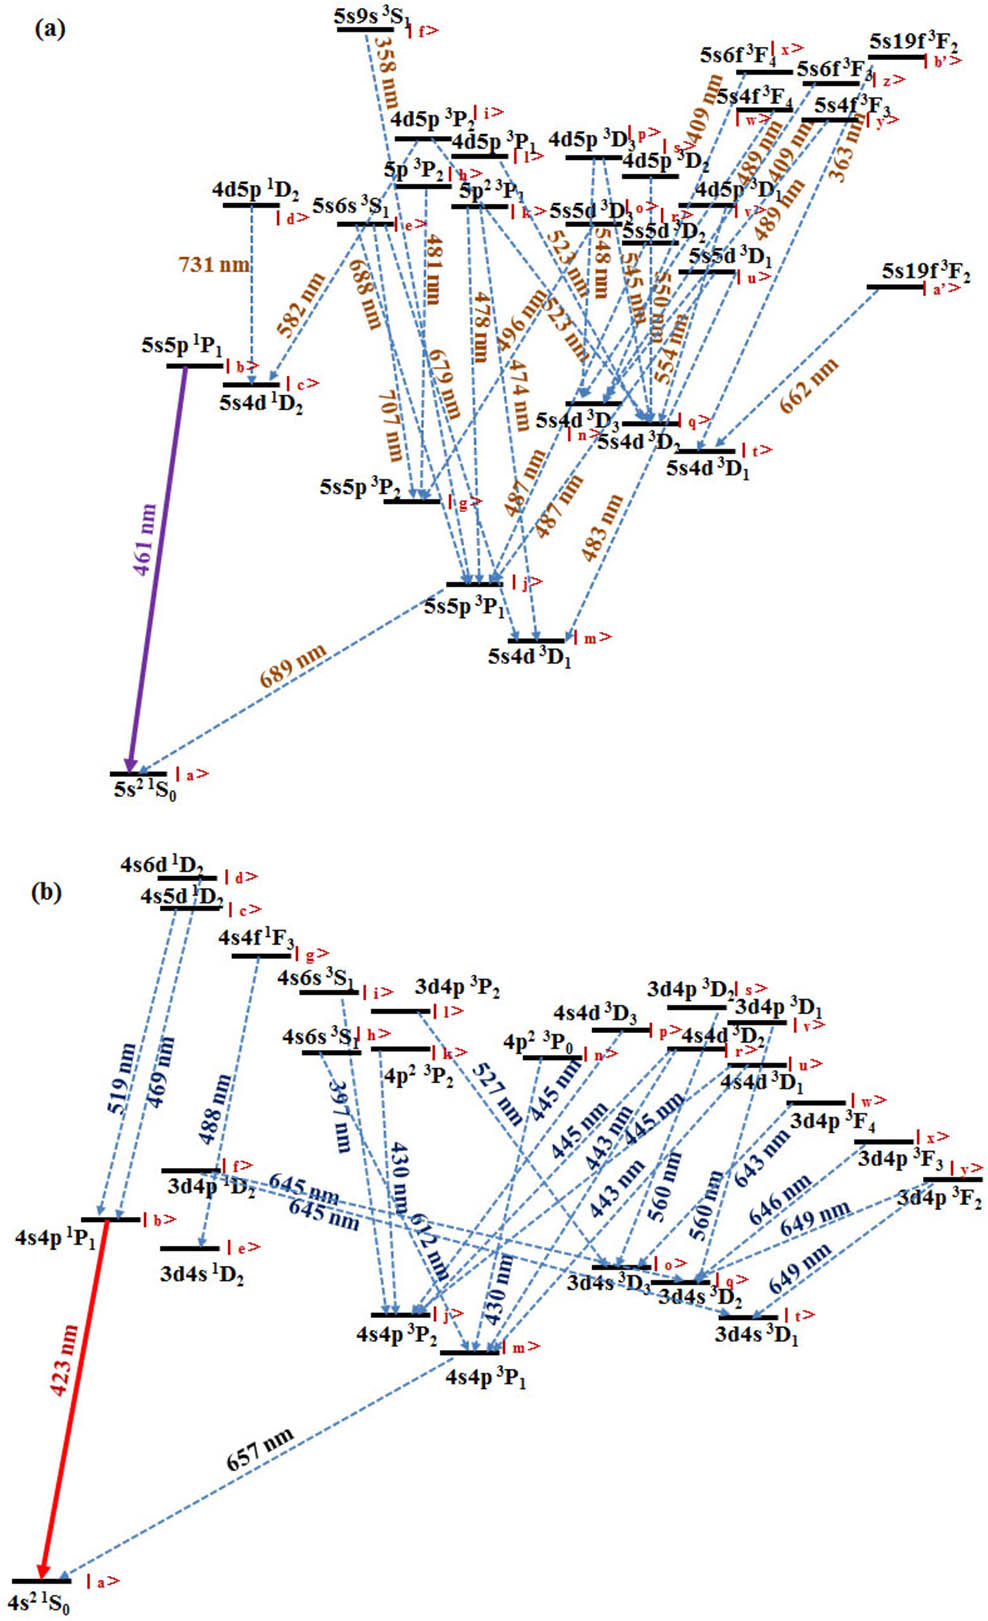
    Fig. 2. (a) Energy diagram of Sr atoms’ transitions. (b) Energy diagram of Ca atoms’ transitions.
    Measured spectral intensities of Ca HCL (red line), Sr HCL (blue line), and the element-balance-detection signal with little effect of the buffer gas-lines (purple line).
    Fig. 3. Measured spectral intensities of Ca HCL (red line), Sr HCL (blue line), and the element-balance-detection signal with little effect of the buffer gas-lines (purple line).
    (a) Intensities of 397, 423, 430 nm of Ca atoms and 358, 363, 408 nm of Sr atoms. (b) The intensities of 443, 445, 519, 527 nm of Ca atoms and 461, 474, 478, 481, 483, 487, 489, 496, 523 nm of Sr atoms. (c) The intensities of 560, 612 nm of Ca atoms and 545, 548, 550, 554, 581 nm of Sr atoms. (d) The intensities of 643, 645, 646, 649 nm of Ca atoms and 662, 679, 688, 689, 707, 731 nm of Sr atoms.
    Fig. 4. (a) Intensities of 397, 423, 430 nm of Ca atoms and 358, 363, 408 nm of Sr atoms. (b) The intensities of 443, 445, 519, 527 nm of Ca atoms and 461, 474, 478, 481, 483, 487, 489, 496, 523 nm of Sr atoms. (c) The intensities of 560, 612 nm of Ca atoms and 545, 548, 550, 554, 581 nm of Sr atoms. (d) The intensities of 643, 645, 646, 649 nm of Ca atoms and 662, 679, 688, 689, 707, 731 nm of Sr atoms.
    λ (nm)I (a.u.)Aμη/106s1Transition Level
    397.3708180517.54s6sS314s4pP32
    422.6728420052184s4pP114s2S10
    430.252853651364p2P324s4pP32
    430.77441994p2P304s4pP31
    443.49574714674s4dD324s4pP31
    443.567934.24s4dD314s4pP31
    445.47796688874s4dD334s4pP32
    445.5887204s4dD324s4pP32
    445.66162.454s4dD314s4pP32
    518.884460836404s5dD124s4pP11
    527.027014172503d4pP323d4sD33
    560.1277310018.63d4pD323d4sD33
    560.2842143d4pD313d4sD32
    612.22171230128.74s5sS314s4pP32
    643.907520413533d4pF343d4sD33
    644.98081735593d4pD123d4sD31
    645.5598150431.43d4pD123d4sD32
    646.2567473d4pF333d4sD32
    649.378110966443d4pF323d4sD31
    649.96508.13d4pF323d4sD32
    Table 1. Wavelengths, Spectral Signal Relative Intensities, Spontaneous Transition Probabilities, and Transition levels of Ca Atomsa
    λ (nm)I (a.u.)Aμη/106s1Transition Level
    357.7243519Afj5s9sS315s5pP31
    362.91441534Abt5s7dD315s5pP30
    408.73444326Axn5s6fF345s4d3D3
    408.7442Ayn5s6fF335s4dD33
    460.7331570232015s5pP115s2S10
    474.19221818395p2P315s5pP30
    478.431982641305p2P315s5pP31
    481.187998708905p2P325s5pP32
    483.204255721335s5dD315s5pP30
    487.249011350485s5dD325s5pP31
    487.6074526.35s5dD315s5pP31
    489.198002426385s4fF345s4dD33
    489.264204.35s4fF335s4dD33
    496.226301373061.45s5dD335s5pP32
    522.92679687222.74d5pP325s4dD32
    523.85479734d5pP315s4dD32
    545.08373199614.74d5pD335s4dD32
    548.0863815568794d5pD335s4dD33
    550.41818059544d5pD325s4dD32
    554.0050290228.44d5pD315s4dD32
    581.677023290.34d5pP325s4dD12
    661.726513486164d5pF325s4dD13
    679.1019811578.95s6sS315s5pP30
    687.831284723275s6sS135s5pP31
    689.2589448940.04695s5pP315s2S10
    707.00723107425s6sS315s5pP32
    730.941662318394d5pD125s4dD12
    Table 2. Wavelengths, Spectral Signal Relative Intensities, Spontaneous Transition Probabilities, and Transition Levels of Sr Atomsa
    nμ/nb(Sr)Value(Sr)nμ/nb(Ca)Value(Ca)
    nk/nb0.69ni/nb0.50
    nh/nb0.35nc/nb9.70
    nu/nb0.64nl/nb1.83
    no/nb0.85nh/nb3.24
    np/nb0.70nw/nb3.04
    ns/nb0.62nx/nb2.54
    nv/nb0.43ny/nb1.68
    ni/nb5.03(2nk+3ny)/nb0.36
    na/nb1.11(4np+nr)/nb1.84
    ne/nb0.68(2ns+3nv)/nb49.64
    nj/nb550.29nf/nb13.21
    nd/nb0.33
    (2nr+nu)/nb1.61
    (9nz+ny)/nb2.14
    (ni+3nl)/nb1.21
    (Afjnf)/nb1.42
    (Abtnb)/nb3.76
    (Axnnx+Aynny)/nb13.54
    Table 3. Sr HCL and Ca HCL Calculation Results of nμ/nη
    Pengyuan Chang, Bo Pang, Yisheng Wu, Jingbiao Chen. Excited-state population distributions of alkaline-earth metal in a hollow cathode lamp[J]. Chinese Optics Letters, 2018, 16(3): 033001
    Download Citation