State Key Laboratory of Advanced Optical Communication System and Network, School of Electronics Engineering and Computer Science, Peking University, Beijing 100871, China
Pengyuan Chang, Bo Pang, Yisheng Wu, Jingbiao Chen. Excited-state population distributions of alkaline-earth metal in a hollow cathode lamp[J]. Chinese Optics Letters, 2018, 16(3): 033001
Copy Citation Text
The intensities of fluorescence spectral lines of Ca atoms and Sr atoms in two different hollow cathode lamps (HCLs) are measured by element-balance-detection technology. In the wavelength range of 350–750 nm in the visible spectral region, using the individual strongest line (Ca 422.67 nm, Sr 460.73 nm) as the bench mark, the population ratios between the excited states of Ca atoms and Sr atoms are calculated by rate equations and the spontaneous transition probabilities. The HCLs with populations at excited states can be used to realize the frequency stabilization reference of the laser frequency standard.
Hollow cathode lamps (HCLs) with alkaline-earth metal are attracting growing attention nowadays as sources of intense atomic spectral lines in various physical devices applied in atomic absorption and emission spectroscopy[1–3]. Furthermore, the atom unit most frequently employed in a traditional Faraday anomalous dispersion optical filter (FADOF)[4] is a vapor cell with atomic density determined by thermal equilibrium[5–8]. Hence, the samples of atomic filters have to be heated to high temperatures to get an atomic density high enough to guarantee the transmittance[9,10]. To overcome this limitation, an innovative method of utilizing an HCL to realize a Sr element FADOF was proposed, as the HCLs can provide the high atomic density at room temperature[11]. Moreover, since the state-of-the-art HCLs cover about 70 kinds of high melting point metal elements, we believe that, due to its rich spectral lines, without heating, scalability, low fabrication cost, and potential applications in various atomic spectra[12–16] they can be used in submarine communication systems as well as excited-state FADOFs without the use of a pump laser[5,6].
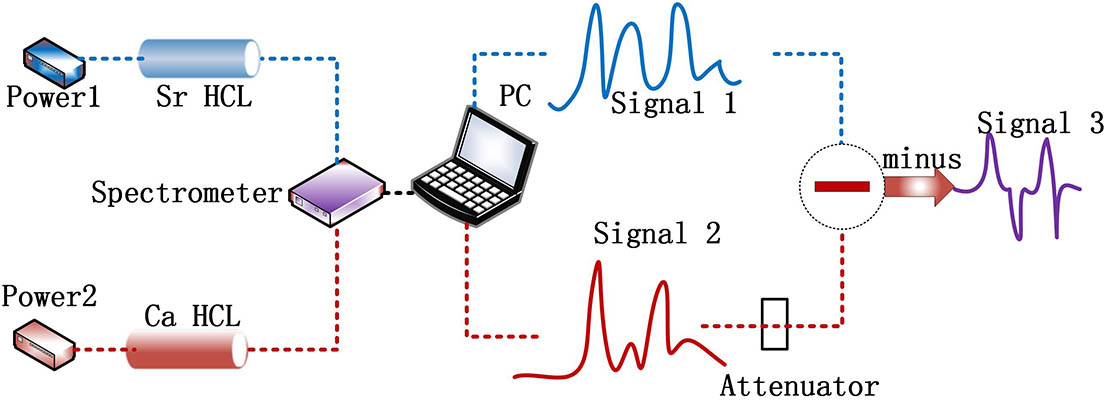
Basic knowledge about HCLs is meaningful for the exploration of further applications[17,18]. The HCLs have rich atomic spectral lines; nevertheless, the spectral measurements are often contaminated by buffer gas-line interference[14–23]. A new method of measurement, as shown in Fig. 1, element-balance-detection technology, is introduced by us, which can remove the effect of the buffer gas-line via the subtraction relation between two spectral signals of Ca HCL and Sr HCL, as shown in Figs. 2 and 3. This method is simply described as follows: two spectral signals of Ca HCL and Sr HCL both include the buffer gas-line; in order to distinguish the atom lines between the spectral signals, we conduct a subtraction operation of two signals to make the buffer gas-lines offset each other. Although the components of the buffer gas may be different, the results imply that the subtraction procedure is coping better with this problem. Hence, the element-balance-detection technology is applicable for similar situations in atomic spectroscopy measurement, which exists in the interference of impurity lines.
Figure 1.Experimental schemes of Ca HCL and Sr HCL in the configuration of element-balance-detection technology for spectrum research.
Figure 3.Measured spectral intensities of Ca HCL (red line), Sr HCL (blue line), and the element-balance-detection signal with little effect of the buffer gas-lines (purple line).
In this Letter, we measured the intensities of fluorescence spectral lines of Ca and Sr atoms in two different HCLs, respectively. In the wavelength range of 350–750 nm in the visible spectral region, using the individual strongest line (Ca 422.67 nm, Sr 460.73 nm) as the bench mark, we calculated the population ratios between the excited states by rate equations and spontaneous transition probabilities. The measured results showed that the intensities of the spectral lines of Ca and Sr atoms are significantly different.
Sign up for Chinese Optics Letters TOC. Get the latest issue of Chinese Optics Letters delivered right to you!Sign up now
The measurement setup is schematically shown in Fig. 1. Figure 2 shows the energy diagrams of the transitions related to the Ca and Sr atoms’ spectral signal. The Sr HCL and Ca HCL are powered by Power1 and Power2 (generating a current range of 0 to 20 mA), respectively, which are placed across the cathode and anode terminals. The intensities of the fluorescence spectral lines of Ca and Sr atoms were strikingly different along with the current increase. The USB2000+ spectrometer in connection with a personal computer (PC) produced by Ocean Optics Company in USA with a resolution of 1.5 nm is used to measure the fluorescence spectra. One path is Ca HCL spectral signal 1, and the other path is Sr HCL spectral signal 2. Since the spectrometer has only one channel, signals 1 and 2 were not measured simultaneously. The measured signals can be adjusted by a suitable attenuator (coefficient), which is an appropriate constant coefficient, to adjust the amplitude when processing the data. The measured spectral signals are shown in Fig. 3.
When the distance of the spectrometer from the HCLs is set appropriately, the current of Power1 and Power2 is set to be 17 and 20 mA, respectively. The relative intensities of the spectral lines of Ca atoms and Sr atoms can be detected, as shown in Fig. 3. In order to display the signal clearly, it is divided into four pictures according to the wavelength ranges, as shown in Fig. 4. The wavelength ranges of Figs. 4(a), 4(b), 4(c), and 4(d) are 340–440, 440–540, 540–640, and 640–740 nm, respectively.
Figure 4.(a) Intensities of 397, 423, 430 nm of Ca atoms and 358, 363, 408 nm of Sr atoms. (b) The intensities of 443, 445, 519, 527 nm of Ca atoms and 461, 474, 478, 481, 483, 487, 489, 496, 523 nm of Sr atoms. (c) The intensities of 560, 612 nm of Ca atoms and 545, 548, 550, 554, 581 nm of Sr atoms. (d) The intensities of 643, 645, 646, 649 nm of Ca atoms and 662, 679, 688, 689, 707, 731 nm of Sr atoms.
By reference to the NIST atomic spectra database[24], the spontaneous transition probabilities and the wavelengths involved in the calculation are listed in Table 1 (Ca) and Table 2 (Sr). Data in columns 1–4 are wavelengths, spectral signal intensities, spontaneous transition probabilities, and transition level, respectively.
λ (nm)
I (a.u.)
Aμη/106s−1
Transition Level
397.3708
1805
17.5
4s6sS31→4s4pP32
422.6728
42005
218
4s4pP11→4s2S10
430.2528
5365
136
4p2P32→4s4pP32
430.7744
199
4p2P30→4s4pP31
443.4957
4714
67
4s4dD32→4s4pP31
443.5679
34.2
4s4dD31→4s4pP31
445.4779
6688
87
4s4dD33→4s4pP32
445.5887
20
4s4dD32→4s4pP32
445.6616
2.45
4s4dD31→4s4pP32
518.8844
60836
40
4s5dD12→4s4pP11
527.0270
14172
50
3d4pP32→3d4sD33
560.1277
31001
8.6
3d4pD32→3d4sD33
560.2842
14
3d4pD31→3d4sD32
612.2217
12301
28.7
4s5sS31→4s4pP32
643.9075
20413
53
3d4pF34→3d4sD33
644.9808
17355
9
3d4pD12→3d4sD31
645.5598
15043
1.4
3d4pD12→3d4sD32
646.2567
47
3d4pF33→3d4sD32
649.3781
10966
44
3d4pF32→3d4sD31
649.9650
8.1
3d4pF32→3d4sD32
Table 1. Wavelengths, Spectral Signal Relative Intensities, Spontaneous Transition Probabilities, and Transition levels of Ca Atomsa
The intensities of the atomic lines depend on the number of sputtered metal atoms, which depends on the kinetic energy of the buffer gas ions, which, in turn, is dictated by the lamp current.
The intensity (P) of the transition signal between two energy levels can be expressed as , where is the transition wavelength, is the atomic density in the level numbered (), is the spontaneous transition probability between the and energy levels, is the transition frequency, and is the Planck constant[22,25,26]. The Ca atoms’ transition signal intensity studied can be clearly expressed with Eqs. (1)–(13). The Sr atoms’ transition signal intensity studied can be clearly expressed with Eqs. (14)–(36):
From Eqs. (1)–(13), the 423 nm transition of Ca atoms has only one spectral line corresponding to the transition, . Given that the population at the energy level is the maximum, the value of is used as the bench mark to calculate the results of . The calculated results of of Ca atoms are shown in Table 3. Because the number of unknowns is larger than the number of equations, we finally get several sets of algebraic results; those are the results obtained in the bottom lines in Table 3.
nμ/nb(Sr)
Value(Sr)
nμ/nb(Ca)
Value(Ca)
nk/nb
0.69
ni/nb
0.50
nh/nb
0.35
nc/nb
9.70
nu/nb
0.64
nl/nb
1.83
no/nb
0.85
nh/nb
3.24
np/nb
0.70
nw/nb
3.04
ns/nb
0.62
nx/nb
2.54
nv/nb
0.43
ny/nb
1.68
ni/nb
5.03
(2nk+3ny)/nb
0.36
na′/nb
1.11
(4np+nr)/nb
1.84
ne/nb
0.68
(2ns+3nv)/nb
49.64
nj/nb
550.29
nf/nb
13.21
nd/nb
0.33
(2nr+nu)/nb
1.61
(9nz+ny)/nb
2.14
(ni+3nl)/nb
1.21
(Afjnf)/nb
1.42
(Ab′tnb′)/nb
3.76
(Axnnx+Aynny)/nb
13.54
Table 3. Sr HCL and Ca HCL Calculation Results of nμ/nη
From Eqs. (14)–(36), the 461 nm transition of Sr atoms also has only one spectral line corresponding to the transition, 5s5p . Given that the population at the energy level is the maximum, the value of is used as the bench mark to calculate the results of . The calculated results of of Sr atoms are shown in Table 3. By reference to the NIST atomic spectra database[24], because of the absence of the spontaneous transition probability between the corresponding energy levels , , , and , we can only use the symbols to calculate the equations and display the results.
As shown in Table 3, the populations at the other energy levels are also very large. However, due to the wavelength spacing of 1 nm between 643, 645, and 646 nm, the overlap of signals and the relative lower resolution of 1.5 nm of the spectrometer may bring measurement errors. But, this problem can be solved by using a high-resolution spectrometer. In addition, because the measurable range of the spectrometer, 400–1000 nm, did not cover all the lines of Ca and Sr atoms, some higher excited states may not be considered. Hence, the calculated population ratios have the errors . Since the state-of-the-art commercial HCLs cover about 70 kinds of high melting point metal elements and can excite large amounts of levels of neutral atoms, they thus provide abundant transitions for frequency standard fields, etc.[27–31]
In conclusion, population ratios between the excited states according to the spontaneous transition probabilities with rate equations and the measured intensities of fluorescence spectral lines of Ca atoms and Sr atoms in HCL within the visible spectral region from 350 to 750 nm are calculated; the population density of the energy level is also obtained. Sufficient populations at the excited states are found when the HCLs are lit. The HCLs with populations at excited states can be used to realize the frequency stabilization reference of the laser frequency standard[12,23,32–40].
Pengyuan Chang, Bo Pang, Yisheng Wu, Jingbiao Chen. Excited-state population distributions of alkaline-earth metal in a hollow cathode lamp[J]. Chinese Optics Letters, 2018, 16(3): 033001