• Journal of Infrared and Millimeter Waves
  • Vol. 40, Issue 5, 655 (2021)
Yi-Cheng SHENG1、2, Xiong DUN1, Su QIU1、*, Li LI1, Wei-Qi JIN1, and Xia WANG1
Author Affiliations
  • 1Beijing Institute of Technology,MOE Key Laboratory of Optoelectronic Imaging Technology and System,Beijing 100081,China
  • 2Beijing Institute of Technology,Zhuhai 519088,China
  • show less
    DOI: 10.11972/j.issn.1001-9014.2021.05.012 Cite this Article
    Yi-Cheng SHENG, Xiong DUN, Su QIU, Li LI, Wei-Qi JIN, Xia WANG. On-orbit non-uniformity correction method for infrared remote sensing systems using controllable internal calibration sources[J]. Journal of Infrared and Millimeter Waves, 2021, 40(5): 655 Copy Citation Text show less
    Flow chart of the CICS-NUC method.
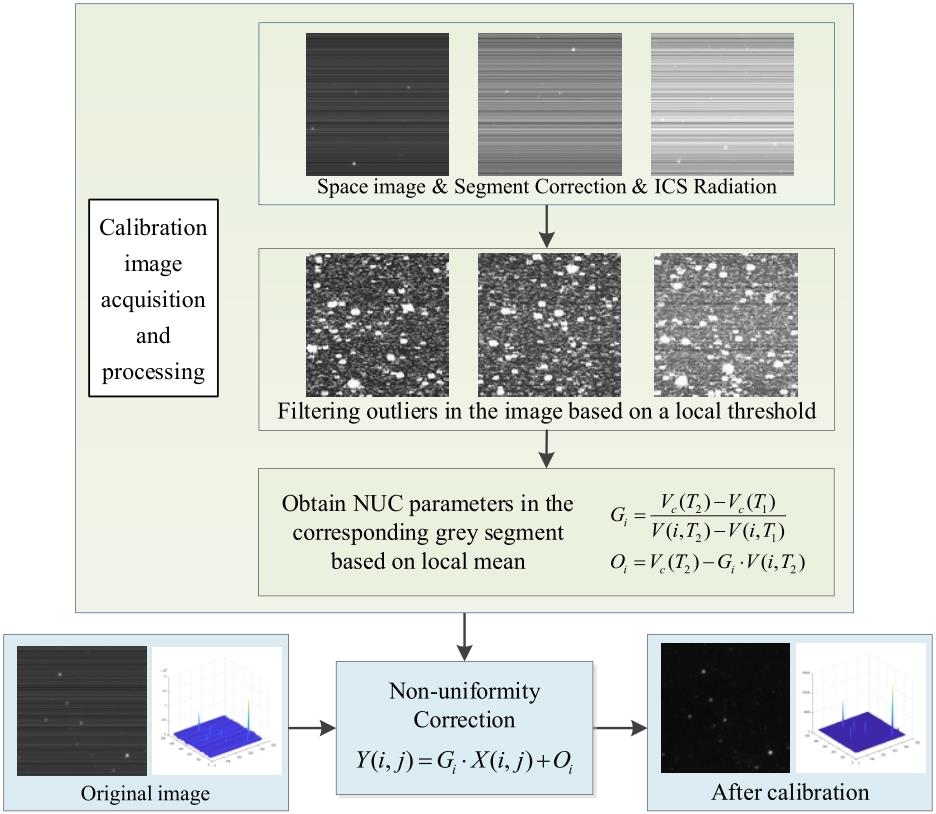
    Fig. 1. Flow chart of the CICS-NUC method.
    Image data obtained by a scanning IRFPA with different ICS output(e.g. ICS equivalent output is 6000):the original space image data superposed with the ICS radiance,FPN,and random noise.
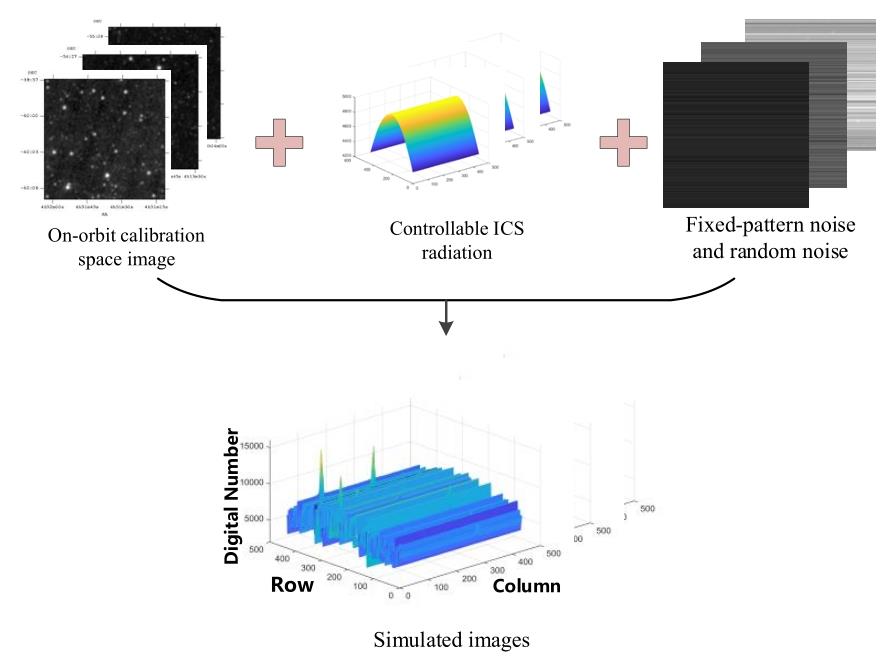
    Fig. 2. Image data obtained by a scanning IRFPA with different ICS output(e.g. ICS equivalent output is 6000):the original space image data superposed with the ICS radiance,FPN,and random noise.
    Images(f (x, y))obtained before the NUC by superposing various influence factors and a controllable steady-mode ICS equivalent output at 500,2000,3000,5500,and 6000.
    Fig. 3. Images(fx y))obtained before the NUC by superposing various influence factors and a controllable steady-mode ICS equivalent output at 500,2000,3000,5500,and 6000.
    Figure 3′s outlier is marked during the filtering process.
    Fig. 4. Figure 3′s outlier is marked during the filtering process.
    Evaluation images for the validation process: (a) gray-scale baseline equivalent output of 1500, NU = 19.15%; (b) gray-scale baseline equivalent output of 5000, NU = 15.87%.
    Fig. 5. Evaluation images for the validation process: (a) gray-scale baseline equivalent output of 1500, NU = 19.15%; (b) gray-scale baseline equivalent output of 5000, NU = 15.87%.
    With the ICS radiation at 2000 and 6000 as the calibration points, the correction results of Fig. 5b are evaluated by different algorithms: (a) global mean two-point correction algorithm; (b) local mean two-point correction algorithm.
    Fig. 6. With the ICS radiation at 2000 and 6000 as the calibration points, the correction results of Fig. 5b are evaluated by different algorithms: (a) global mean two-point correction algorithm; (b) local mean two-point correction algorithm.
    Non-uniformity evaluation before and after NUC of each test image.
    Fig. 7. Non-uniformity evaluation before and after NUC of each test image.
    NUC evaluation of test images by using different segmentation interval local mean algorithms.
    Fig. 8. NUC evaluation of test images by using different segmentation interval local mean algorithms.
    Implementing the proposed CICS-NUC algorithm on an actual space scene.
    Fig. 9. Implementing the proposed CICS-NUC algorithm on an actual space scene.
    NUC evaluation of test images by using MICS-NUC and CICS-NUC algorithms.
    Fig. 10. NUC evaluation of test images by using MICS-NUC and CICS-NUC algorithms.
    NUC algorithms

    Non-uniformity of the test image after NUC

    (ICS-1500,NU = 19.15%)

    Non-uniformity of the test image after NUC

    (ICS-5000,NU = 15.87%)

    Internal calibration sources output as calibration pointsAlgorithm adopted
    2000 and 6000Global mean value algorithm3.24%6.06%
    2000 and 6000Local mean value algorithm0.68%1.18%
    500 and 3000Segmentation interval local mean algorithm0.64%1.21%
    3000 and 5500Segmentation interval local mean algorithm0.72%1.17%
    Table 1. Non-uniformity correction (NUC) results from the test images in Fig. 5.
    Yi-Cheng SHENG, Xiong DUN, Su QIU, Li LI, Wei-Qi JIN, Xia WANG. On-orbit non-uniformity correction method for infrared remote sensing systems using controllable internal calibration sources[J]. Journal of Infrared and Millimeter Waves, 2021, 40(5): 655
    Download Citation