
Yi-Cheng SHENG, Xiong DUN, Su QIU, Li LI, Wei-Qi JIN, Xia WANG. On-orbit non-uniformity correction method for infrared remote sensing systems using controllable internal calibration sources[J]. Journal of Infrared and Millimeter Waves, 2021, 40(5): 655
- Journal of Infrared and Millimeter Waves
- Vol. 40, Issue 5, 655 (2021)
Abstract
Keywords
Introduction
The Nonuniformity correction(NUC)is a crucial procedure for infrared remote sensing [
In this study,based on the optical structure of previous research [
1 NUC Method with CICS
MICS-NUC and CICS-NUC methods have the same on-orbit radiometric calibration device and system structure. The proposed push-room imaging high-earth-orbit system employs a linear dual-band IRFPA [
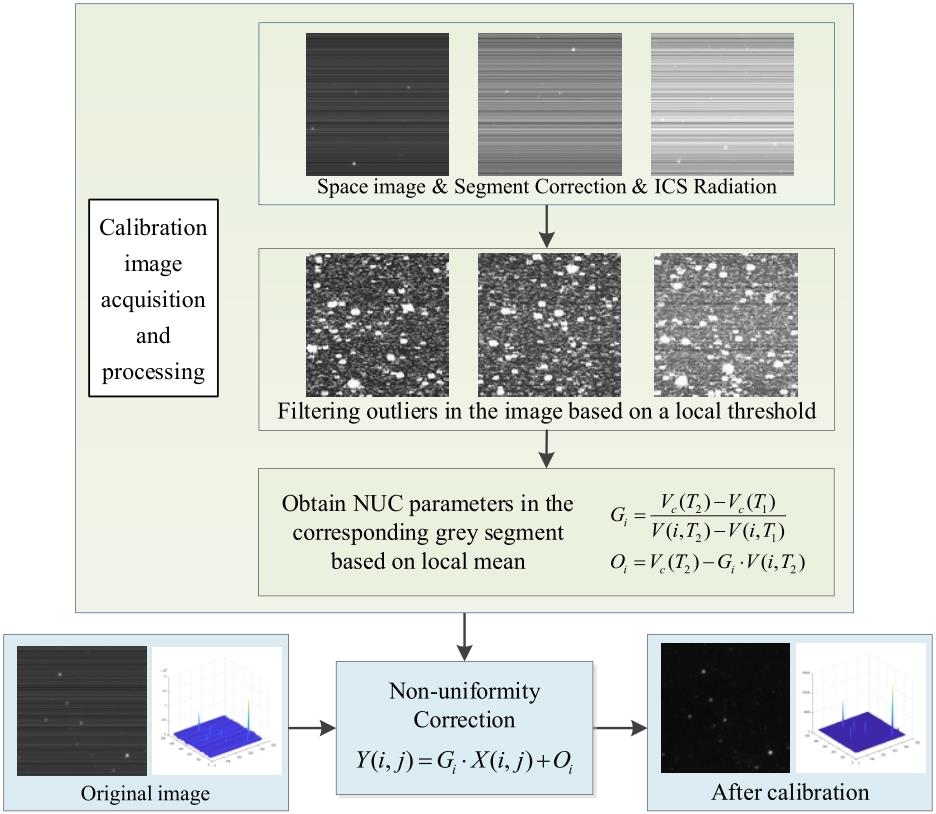
As bright stars are not conducive to the calibration process,their effect must be reduced. Another challenge is the difficulty encountered by the IRFPA when obtaining different levels of radiance directly from the space scene. Thus,the proposed approach uses a controllable ICS with various levels of radiance to obtain multiple calibration images for HDR calibration during the IRFPA scan. The on-orbit NUC based on controllable CICS-NUC method has two processing steps:a filtering process based on a local threshold and a segmentation two-point calibration based on a local mean. From the perspective of solving the key problems and the NUC image of the infrared system under the ICS operating in steady-state mode,the scene based adaptive NUC algorithm in this paper adopts the dynamic linear correction method.
![]()
Figure 1.Flow chart of the CICS-NUC method.
1.1 Filter the Image Outliers Based on a Local Threshold
As a few luminous stars within the deep-space background scene directly influence the estimation of the corrected true value,these sampled points must be filtered out. Furthermore,calibration images also contain other influential factors such as random noise of sensors and ICS illumination distribution non-uniformity. Therefore,the proposed algorithm adopts a filtering process based on a local threshold value. This approach discussed in the previous research(MICS-NUC)is to compute a threshold at every point(x,y)in the calibration image f(x, y)based on two specified properties computed in a neighborhood sxy[
where r is the radius(d = 2r + 1),x = 1,2,…,M and y = 1,2,…,N;M and N are the rows and columns in the image. By determining the point-by-point local thresholds of the image,an image g(x, y)with marked outliers can be obtained.
where a and b are the non-negative thresholds determined by experiments in advance. Note that in the section 2.2,the digital number of the marked point is ignored,the remaining pixels will be preserved as digital number of g(x, y).
The parameter of the filtering process in the CICS-NUC method is determined by comparing the NUC effects in advance. The increase in the parameter d(the size of the neighborhood)not only increases the amount of calculation but also calculates another star,and therefore,the error increases. The parameter d should be close to the pixel size of the bright star;we set d = 9. The parameters a and b are descriptors of average intensity and local contrast,respectively. When b ranges from 10 to 13,and a ranges from 39 to 100,the NUC result at low gray-scale segments is optimal(gray-scale segments smaller than ICS-2000). The change of the parameters a and b do not have a large effect on the high gray-scale segments. This is because,when the system performs calibration operations for areas with fewer stars,the brighter pixels remaining after the filtering step will only have a greater impact on the calibration process of the low gray-scale. To better obtain the correction results of low gray-scale segments,d = 9,a = 40,and b = 13 are taken as the optimal local threshold parameters of the filtering process with various filtering parameters analysis. MICS-NUC and CICS-NUC methods have the same filtering process,but the parameter values of the two algorithms are not the same.
1.2 Segmentation Two-Point Calibration Based on Local Mean
Because of the HDR and the obvious nonlinear response of the system,the typical linear response model is no longer applicable. Therefore,according to the dynamic range and calibration accuracy requirements,the IRFPA’s dynamic range(Rmin, Rmax)is divided into K intervals(Rk-1,Rk),where k = 1,2,…,K,R0 = Rmin,and RK= Rmax. Calibration is executed respectively in each interval(segment)based on the linear response model. This paper takes the two-point algorithm as an example. According to the linear model,the size of the scanning IRFPA obtained is M × N. Assume that the IRFPA NUC model is
where Gi and Oi are the gain and offset parameters of the i-th channel,respectively,X(i, j)is the original output image,and Y(i,j)is the output image after NUC for the IRFPA. While the IRFPA is in the imaging process,the input radiance from the scene is used to select the corresponding NUC coefficients at each interval,and then complete the corresponding NUC according to the NUC equation.
The segmentation NUC can be executed in advance in the laboratory. When the on-orbit environment is simulated,the on-board controllable ICS provides reference radiance for segmentation calibration. The on-orbit segmentation interval and the calibration temperature points in the intervals are initially set during pre-launch calibration. The initial gain parameter GLab and offset parameter OLab can be continuously optimized according to the pre-launch calibration result. The segmentation interval,calibration point,and initial parameters are important coefficients for the subsequent calibration process.
A common algorithm to the NUC is to perform measurements with a blackbody source at two different absolute temperatures, T1 and T2,and then,to solve for the NUC coefficients. The average of the output values of all detectors is used as the corrected true value. This two-point method is performed using the global mean value as the corrected true value as follows:
where V(i,T1)
Because the infrared camera is also affected by the weak background radiation of deep space,an NUC algorithm based on a local mean to obtain relative radiation calibration parameters is used. The parameters are obtained as follows:
The radiance of the ICS is used as a calibration source for an infrared remote sensing system;however,it will bring non-uniformity of illumination distribution of 1.3% through the calibration optical system [
1)For one frame of the image at temperature T1,the mean of each channel is averaged along the scanning direction. The mean of the effective value of the i-th channel is V(i,T1)and the group of all channels are set as matrix Q.
2)In the laboratory,NUC is processed using a standard blackbody source. After obtaining the initial NUC parameters,GLab and OLab,for each interval,matrix Q is corrected using the NUC parameters obtained in Step 1. Then,the corrected matrix Q constitutes matrix Q1.
3)To reduce the influence of weak background radiation,two-round mean filtering is executed on Q1 to obtain matrix Q2. The size of the filter is determined by the fluctuation of weak background radiation.
4)To eliminate the influence of ICS illumination distribution non-uniformity,Q2 is corrected according to the laboratory NUC parameters. The infrared system is aimed at the cold screen space simulator,the distribution of the ICS is calculated,and the mean value of the effective pixels of each channel is obtained. After normalizing,set the group of all channels as the matrix P. The non-uniformity distribution of the ICS is mapped to the matrix Q2 to obtain a local mean Vlocal(T1),as detailed in
The average value V(i,T2)and the local mean Vlocal(T2)of the effective pixels of the i-th channel of the calibration image of temperature T2 are obtained in the same manner by repeating Steps 1 through 4. The local mean values,Vlocal(T1)and Vlocal(T2),are substituted for the global mean values Vc(T1)and Vc(T2)in
The non-uniformity of the IRFPA changes with the operating state or environment,thus,a dynamic NUC is required. The system restarts the calibration process when the deviation becomes crosses a threshold determined by the algorithm and updates the calibration parameters accordingly. When the system is in observation mode,the ICS is turned off,and the IRFPA imaging data is subjected to NUC using
2 Verification and Results
To verify the efficacy of the CICS-NUC method,we analyzed and evaluated an implementation of the proposed algorithm on a simulation of on-orbit NUC for an infrared remote sensing system.
2.1 Simulation Images Acquisition
The simulated non-uniformity image was obtained by adding the influencing factors to the IRFPA during the radiometric calibration process while pointed at a specific area with a small number of stars exist in the deep space. The influencing factors included the controllable ICS illumination distribution [
Based on the assumptions that the infrared remote sensing system points to the deep space during the calibration process and that a small amount of star irradiance exists in the acquired calibration specific area,we selected an actual space scene from the Wide-field Infrared Survey Explorer mission(WISE)in the W2 band(4.36 μm)acquired from the NASA/IPAC Infrared Science Archive [
Influential factors were added to the original space scene. Note that the following simulated images are all equivalent 14-bit gray-scale images. For the M channels of IRFPA,the output image Xk(M)of each influencing factor was added to the space scene Sk(M)below K intervals,
where a1(M)is the illumination non-uniformity of the ICS,a2k(M)is the gain of the sensor,o2k(M)is the offset of the sensor,and o3(M)is the random noise of the sensor.
We assumed that a1(M)followed a Gaussian distribution;then,
The position parameter and the scale parameter are set at μ = 218 and σ = 300,respectively. As a result,the illumination from the ICS caused the radiance at the edge of the IRFPA to be approximately 0.88 times that of the center of the IRFPA. Taking the ICS equivalent radiance output at 6000 for example,the original space image with the ICS radiance distribution is obtained after the scanning of the IRFPA.
We also assumed that the sensor’s gain a2k(M)and sensor’s offset o2k(M)followed a Gaussian random distribution with means of 1 and 850,and standard deviations of 0.17 and 350,respectively. The sensor’s random noise o3(M)conformed to a Gaussian distribution with a mean of 0 and a standard deviation of 10. Based on the
![]()
Figure 2.Image data obtained by a scanning IRFPA with different ICS output(e.g. ICS equivalent output is 6000):the original space image data superposed with the ICS radiance,FPN,and random noise.
2.2 Algorithm Process and Effects
2.2.1 Filtering on the Image
During the simulation of the on-orbit radiometric calibration,when the system pointed to the deep space scene,superposed calibration images of deep space and the multistage internal calibration radiance with the scanning process were obtained for the CICS-NUC method.
![]()
Figure 3.Images(f (x, y))obtained before the NUC by superposing various influence factors and a controllable steady-mode ICS equivalent output at 500,2000,3000,5500,and 6000.
![]()
Figure 4.Figure 3′s outlier is marked during the filtering process.
2.2.2 NUC Results and Analysis
The deep space scene is not a uniform scene. For evaluating and analyzing the calibration results of the CICS-NUC algorithm,we also simulated a series of test images with the ideal uniform output at the IRFPA(gray-scale baseline equivalent output of 500~10000). The fixed-pattern noise distribution in the test images is the same as that in the simulated images(according to the same model,
![]()
Figure 5.Evaluation images for the validation process: (a) gray-scale baseline equivalent output of 1500, NU = 19.15%; (b) gray-scale baseline equivalent output of 5000, NU = 15.87%.
The test image has the same NUC operation;thus,the change of the test image non-uniformity(NU)also shows the effect of the CICS-NUC algorithm process.
Note that the evaluation parameter,NU,is given as follows:
where M and N are the total number of rows and columns of the IRFPA,respectively;D is the number of dead pixels in the IRFPA;H is the number of overheated pixels in the IRFPA;and Vij is the corresponding pixel out of row i and column j on the IRFPA. The average of all effective pixels’ output on the IRFPA is designated by Vavg. When calculating the sum and NU of the outputs,the values of the invalid pixels were not included.
The difference between using the global mean method and the local mean method is the estimation of the corrected true value. Two-point correction was performed with ICS equivalent gray-scale output 2000 and 6000 as calibration points. The correction was executed using global mean and local mean methods. The correction parameters obtained by different statistics methods were used to evaluate the NU of a series of test images.
![]()
Figure 6.With the ICS radiation at 2000 and 6000 as the calibration points, the correction results of Fig. 5b are evaluated by different algorithms: (a) global mean two-point correction algorithm; (b) local mean two-point correction algorithm.
![]()
Figure 7.Non-uniformity evaluation before and after NUC of each test image.
The high dynamic range IRFPA has the effect of response nonlinearity. To further reduce residual non-uniformity,corrections were implemented using the segment method. With the ICS equivalent gray-scale output at interval 500–3000 and interval 3000–5500 as the calibration points,the two-point method based on the local mean was corrected for the two different correction intervals. The correction parameters obtained by the different intervals were used to evaluate the NU of a series of test images. The non-uniformity evaluation data of the test images is shown in
![]()
Figure 8.NUC evaluation of test images by using different segmentation interval local mean algorithms.
| 2000 and 6000 | Global mean value algorithm | 3.24% | 6.06% |
| 2000 and 6000 | Local mean value algorithm | 0.68% | 1.18% |
| 500 and 3000 | Segmentation interval local mean algorithm | 0.64% | 1.21% |
| 3000 and 5500 | Segmentation interval local mean algorithm | 0.72% | 1.17% |
Table 1. Non-uniformity correction (NUC) results from the test images in Fig. 5.
As indicated in
To obtain the visual effect of the CICS-NUC on the actual deep space scenes,a WISE W2 band image located at 323.841,1.48141 J2000 was added to FPN to simulate an original image before correction,as shown in
![]()
Figure 9.Implementing the proposed CICS-NUC algorithm on an actual space scene.
3 Discussion
MICS-NUC method and CICS-NUC method are based on ICS operated in different modes(pulsed or steady-state mode). The ICS calibration system constructs the calibration images,thus meets the requirements of the SBNUC algorithms. After the variable threshold process of filtering outliers,the on-orbit HDR radiometric calibration can be finished by both of the two methods without blocking the field of view. Both algorithms can not only achieve effective NUC,but also partially correct the non-uniformity of ICS illumination irradiance. By utilizing the same NU response model to create a series of simulated images as test images,the correction effect of the two methods is compared. The correction results are shown in
![]()
Figure 10.NUC evaluation of test images by using MICS-NUC and CICS-NUC algorithms.
1)The correction effect of CICS-NUC method is comparable to the MICS-NUC method in the whole dynamic range. The MICS-NUC method shows better NUC results than the CICS-NUC method at the medium gray level(the grayscale segment is 2000 to 4500)and the high grayscale(the grayscale segment is 4500 to 10000). The CICS-NUC method with calibration points of ICS-500 and ICS-2000 shows better NUC results than the MICS-NUC method with calibration point of ICS-1000 at the low grayscale(the grayscale segment is below 2000).
2)The NUC parameters obtained in the selected greyscale using the MICS-NUC and CICS-NUC methods have a better correction effect than those from other greyscale segments. The calibration point ICS-1000 shows better correction results in the low gray level(the grayscale segment is below 2000)than the MICS-NUC method using the calibration point ICS-2000. Therefore,the selection of the calibration point is crucial to the CICS-NUC method,and the CICS-NUC method obeys the same rules.
Through the comparison test,taking three segmentation intervals as an example,the MICS-NUC method(pulsed mode)using the local constant statistical algorithm requires three calibration points to obtain the calibration parameters. However,CICS-NUC method(steady-state mode)which adopts the local mean based algorithm requires at least four calibration points. Also,there are differences in the processing procedure:the ICS of the MICS-NUC method needs to be set within a certain range,and higher requirements are imposed on the ICS control. But the CICS-NUC method adopts a steady-state mode,which makes the ICS control simple and stable. Compared with the MICS-NUC based on constant statistics algorithm,the CICS-NUC algorithm requires fewer scan columns of the calibration images,resulting an easier engineering implementation. In summary,the two methods are feasible NUC methods with different ICS operating modes. In different ICS operating modes(pulsed mode and steady state mode),the correction effects are also different,and there are different application occasions.
The simulation images of this paper superimpose various factors that may affect the radiometric calibration of the infrared remote sensing system,so that they have enough authenticity and can basically conform the actual situation of the system. The simulation images are corrected independently,and the result shows the validity of the algorithm. This method has important reference value for the design of the actual system. Of course,there are errors or secondary effective factors in this process,and it is necessary to improve it through experiments.
4 Conclusions
In this study,we proposed the CICS-NUC method to solve the problem of response non-uniformity of IRFPA in infrared remote sensing without blocking the entrance pupil. A detailed implementation of the proposed method was introduced,including segmentation,space scene and controllable ICS image acquisition,a variable threshold function for filtering outliers,local mean based two-point NUC,and other algorithms. Verification with simulated images demonstrated that the non-uniformity of the IRFPA was greatly reduced. Compared with other on-board NUC methods requiring reference sources(e.g.,the CBNUC methods)and previous modulated internal calibration source based NUC methods,our CICS-NUC method has the advantages of miniaturization,ease of control and engineering implementation,fewer column scans,less computation,and thus,lower cost. The CICS-NUC method provides an effective solution for the on-orbit HDR dynamic calibration of a scanning IRFPA. We believe the implementation of this calibration method will meet the unmet demands of remote sensing systems in defense,meteorology and several other fields.
References
[2] J. Tansock, D. Bancroft, J. Butler, C. Cao et al. Guidelines for Radiometric Calibration of Electro-Optical Instruments for Remote Sensing(2015).
[5] X. Chun. A flux calibration method for remote sensing satellites using star flux. J. Infrared Millim. Waves, 36, 581-588(2017).

Set citation alerts for the article
Please enter your email address
© Copyright 2018-2021 | Chinese Laser Press. All Rights Reserved 沪ICP备15018463号-20